1-day Summary
3-day Summary
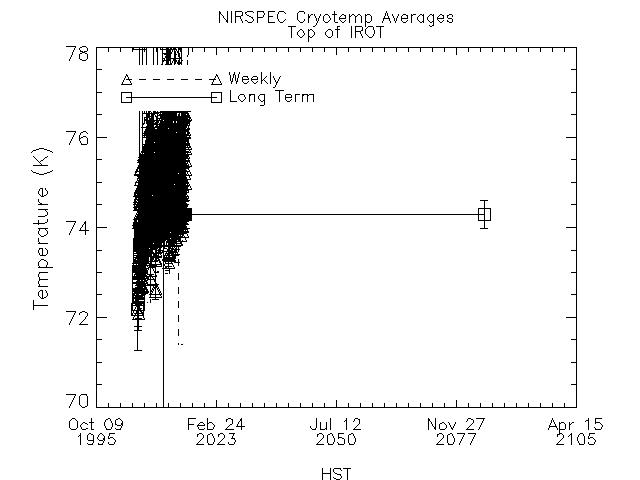
- The following plots show the weekly- and long-term-means of the
NIRSPEC cryotemps.
- Each weekly point is the simple mean of approximately 3000 data
points.
- Each successive long-term point represents more and more data
points, unless that week's data were far outside the norm.
Examples of ignored data are the August 2005 power outage
and the March 2006 service mission.
- The Aladdin temperature (plot 9) is controlled by a heater
circuit. The nominal setpoint is 30 K.