The NIRC2 quicklook GUI is an IDL-based tool to automatically display NIRC2 images in real time as they are being generated by the instrument.
IMPORTANT NOTE on data format. The NIRC2 detector software generates two FITS files per exposure in CDS and MCDS modes:
-
Unprocessed file (n_unp_XXXX.fits):
Multi-extension data cube that where every single sample/read is
saved. For instance, let us assume that we are taking a full
array image in MCDS mode with 8 read pairs and 5 coadds, in
which each coadd has an integration time of 1 second. This
translates into the following detector configuration on
a waikoko-new terminal:
subc 1024
sampmode 3 8
itime 1
coadd 5
The corresponding unprocessed image will have the following format:n_unp_XXXX.fits[0][1:5][1:1024,1:1024,1:16]
where:- HDU[0] Includes a global header without pixels.
- HDU[1:5] Are pixel extensions, one per coadd.
- [1:1024,1:1024,1:16] Data cube including 16 read pairs, each with a full frame size, i.e. 1024x1024 pixels.
-
Processed file (nXXXX.fits): Single extension
FITS file formed by the average of the differences between the
signal in the final group of reads and initial group of reads
accumulated over the number of coadds. In the case of the example
above, the processed image will have the following
format:
nXXXX.fits[0][1:1024,1:1024]
where:- HDU[0] Includes a global header and pixels.
- [1:1024,1:1024] single image with 1024x1024 pixels where the value for each pixel is the result of the arithmetics described above.
The following figure shows the layout of the NIRC2 quicklook GUI:
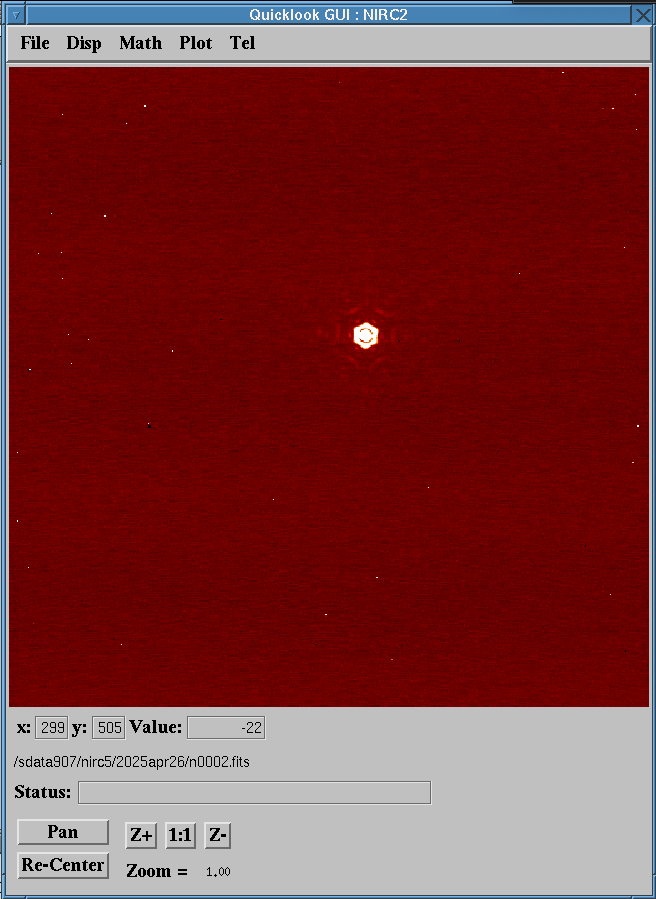
The main window in the quicklook GUI shows the following sections:
NIRC2 images can be opened offline by typing ds9 on
a waikoko-new terminal, but only the NIRC2 quicklook GUI
can automatically display images in real time.
Top pulldown menu
The top pulldown menu includes several sub-menus with the following options:
File
File operations:
- Open..: Navigate through directories and select FITS file to open. NOTE: Multi-extension unprocessed files named n_unp_XXXX.fits will not be displayed. Only single extension processed files (nXXXX.fits) will be displayed.
- Load Instrument Config File: Normally this option should be untouched. Configuration for NIRC2 images is nirc2_cfg.
- Fits Header: Open a separate window where you can inspect the image FITS header.
- Exit: Exit the quicklook GUI and the underlying IDL process.
Disp
Display functions:
- Redisplay: Redisplay the current image.
- Toggle Keep Zoom/Center: If selected, the zoom and pan used for the current image will be conserved for subsequent images.
- Center: Click on the image pixel you would like to go to the center of the display area.
- ReCenter: Move the image center to the center of the display area.
- Color Table: Open a new GUI where you can select a multitude of color palettes and color stretching options.
- Reset Display Parameters: Reset display stretching parameters to the default values. This is a valuable resource when either manual or pre-defined scaling combined with dynamic stretching by right-clicking and dragging on the display area makes it hard or impossible to visualize the image. At that point, it is probably time to reset the display parameters.
-
Set Display Parameters... Open window to manually set the
streching boundaries and pre-defined scaling options:
- Display Min: Minimum pixel value to be mapped to the current color palette.
- Display Max: Maximum pixel value to be mapped to the current color palette.
- Log Scaling: Display image in logarithmic scale.
- Linear Scaling: Display image in linear scale.
- Set AutoScale. Sub-menu for predefined scaling options: None, Hisotgram Equalization, Mean, Median, Min/Max, and Asinh. Options None and Min/Max are identical.
-
Zoom. Sub-menu for predefined zooming options:
- Return to Original: Return to zoom 1:1.
- 1/2x: Zoom out by a factor of 2.
- 2x: Zoom in by a factor of 2.
Math
Mathematical operations:
- SDiff: Display the difference between the latest image and the previous one.
-
Arithmetic: Perform basic arithmetics between two
images. When this option is selected a popup window appears
with the following fields:
- Operand 1: You can type the image name in the text box, click on Pickfile to select the image from a pulldown menu, or click on Current to select the latest image on disk.
- Operation: Check the box corresponding to the desired arithmetical operation: +, -, *, /. The default operation is subtraction.
- Operand 2: You can type the image name in the text box, click on Pickfile to select the image from a pulldown menu, or click on Current to select the latest image on disk.
- OK: Execute the selected operation between the two operands and display resulting image.
- Cancel: Exit arithmetic popup window.
- Options: Arithmetic options to replace Inf and NaN values with floats.
-
Photometry: Perform aperture photometry on the currently
displayed image. When this option is selected, a popup window
appears to select various photometric parameters and display the
results. Left-click on any of the sources in the image to show
the results of the photometric calculation. Available
photometric calculation parameters:
- Zero Point: Zero point magnitude for the filter used in the currently displayed image. Shows default value for filter, but a different value can be typed in the text box.
- Itime: Exposure time per coadd shown in the FITS header of the currently displayed image. A new value can be typed in the text box if desired, e.g. to specify the total exposure time for all coadds.
- Inner Sky An: Radius in pixels of the sky region inner circle.
- Outer Sky An: Radius in pixels of the sky region outer circle.
- Aperture (pix): Radius in pixels of the aperture over which photometric calculations will be performed.
- Calculate: Perform photometric calculations with the selected parameters.
- Ok: Close photometry popup window.
- Cancel: Close photometry popup window.
-
Strehl: Calculate Strehl Ratio and FWHM of the PSF on the
currently displayed image. When this option is selected, a popup
window appears to select Strehl calculation parameters and
display the results. Left-click on any of the sources in the
image to show the results of the Strehl calculation. The
following Strehl calculation parameters are available:
- Width of Box: Width in pixels of the box enclosing the source to calculate the Strehl.
- Height of Box: Height in pixels of the box enclosing the source to calculate the Strehl.
- Lambda: Central wavelength in micron of the filter used in the currently displayed image
- DLambda: Width in micron of the filter used in the currently displayed image.
- Platescale: Plate scale in arcsecond per pixel of the camera used in the currently displayed image.
- Calculate Strehl Ratio: Press this button to calculate the Strehl Ratio (SR). A popup display window zoomed into the selection box will appear. The actual PSF is shown on the left half of the display, while a model of the PSF is shown on the right half of the display. The calculated SR (percentage) and FWHM (arcseconds) are shown at the bottom of the display area. The SR is calculated as the ratio of maxima between the observed PSF and model PSF. The FWHM is estimated as the width of the PSF where the pixel values are 50% of the maximum. Two estimates of each quantity are shown: fwhm and strehl without background subtration, and (fwhmAB and strehlAB with automatic background subtraction. There is an EXIT button to exit the popup display.
- Ok: Close Strehl fit window.
- Cancel: Close Strehl fit window.
-
Reduce: Performs basic infrared data reduction of NIRC2
images including sky subtraction, flat-field correction, and
bad-pixel correction if a bad pixel map is provided. A window
with the following fields pops up when this option is selected:
- Object: Image of the science target that is to be reduced.
- Sky: Sky image with the same dimensions and taken with the same filter as the object image.
- Flat: Flat-field image wuth the same dimensions and taken with the same filter as the object image. It is important to use a normalized flat field to obtain the best reduction results.
- Dead Pixel Map: Specify bad pixel map if the option to use one is selected. A bad pixel map consists of a 2D mask with the same size as the object, flat, and sky images where good pixels have a value of 0 and bad pixels a value of 1.
- Use Dead Pixel Map? Select Yes to use a bad pixel map during the data reduction process.
- Remove Correlated Noise Pattern? Select Yes if you want to filter correlated noise pattern present in the images. Results are uncertain since this option has not been fully tested.
- Automatically Save Reduced File to Disk? Select Yes if you want reduced images to be saved on disk.
- Directory: Data directory where reduced image will be saved if the option to automatically save reduced image is selected.
- Reduced File Root Prefix: Prefix used in the reduced image when saved to disk to avoid overwriting original object image.
- Reduce Serial: If selected, it will reduce object images with frame numbers following the image specified in the Object box. User will be prompted to confirm if it is ok to reduce the next image in the series.
- Reduce: Press this button to start reduction process and generate reduced image.
- Quit: Press this button to close the reduce image popup window.
- Statistics: Obtain image statistis in a rectangular region. Left-click and drag, and then release to define the rectangular region on the displayed image. The size of the rectangular area can ben fine tuned by typing the pixel coordinates of the lower-left and upper-right corners in the (x1, (y1) and (x2, y2) text boxes, respectively.
- Bias/Flat: Select a bias frame to subtract from all images to be displayed in the quicklook. Select a flat-field frame to divide all displayed images by.
Plot
Plotting functions:
- Horizontal Cut:
- Vertical Cut:
- Diagonal Cut:
- Profile at Cursor:
- Gaussian Fit:
- Contour:
- Surface Plot:
Tel
Telescope operations:
- Move Telescope:
Display area
This is the area of the quicklook where the image is displayed. Images can be inspected but be aware that every time a new image is saved to disk, it will be automatically loaded on the display. Display intensity stretching can be modified dinamically by right-click and drag on your mouse while the pointer is on the display area.
Image information
Information about the image on display:
- x: Mouse pointer X coordinate in pixel.
- y: Mouse pointer Y coordinate in pixel.
- Value: Intensity of pixel where the mouse pointer is located.
- File name: Full path to the image on the display.
- Status: Information box that may include instructions for the user such as "click on destination pixel" when offsetting operations are selected.
Zoom and pan controls
Image zoom and pan operations:
- Pan button. When this option is selected, the mouse pointer on the display area turns into a Malta cross. Place the mouse pointer on the pixel you would like to be sent to the center of the display and left click. This will shift the image so that the selected pixel is at the center of the display.
- Re-center button. When this option is selected, the center of the image is centered on the display area.
- Z+ button. Zoom in the display area. Current zoom value appears next to the Zoom field.
- Z- button. Zoom out the display area. Current zoom value appears next to the Zoom field.
- 1:1 button. Sets zoom scale to 1.0. The Zoom field show 1.0 when this option is selected.
1. Video modes are currently unavailable. [back to main text]
Send questions or comments to:NIRC2 Support