Background
The DEIMOS QuickSlit data reduction tool utilizes the DEEP2
DEIMOS spec2d data reduction pipeline to provide a quick
reduction of a single slit from a DEIMOS slitmask. The software
is intended to be used at the telescope as a "quick-look" tool
for inspecting a particular object on a DEIMOS slitmask. The
software will perform a full reduction on a single slit from one
or more science images acquired with the same slitmask and
display the output in the form of both a 2-D sky-subtracted
spectrum and a 1-D extracted spectrum.
Invocation
The QuickSlit tool is launched called using the following command from
any terminal on the data reduction machines (pohue or
hamoa) in Remote Ops II.
quickslit
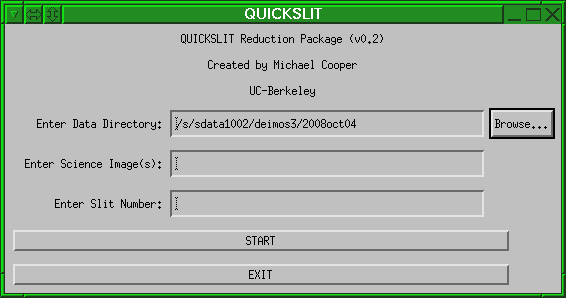
This command will launch the main QuickSlit GUI, shown above.
The GUI allows the user to specify the following information:
- Directory: the directory in which your data
reside. By default, this will be the current DEIMOS data
directory. You can alter the directory by editing the text
directly or by using the Browse... function to
select another directory.
- Images: the (root) names of one or more science
frame(s) to employ in the reduction. The user may specify
multiple science frames by separating the frame numbers by
commas. When multiple frames are passed to QuickSlit, the code
will simply co-add the exposures in the multiple science
frames. The science frames may be specified by any of the
following syntax: "44", "0044", "d0522_0044", or
"d522_0044.fits" to specify the science file
"d0522_0044.fits". However, if the user has selected a
non-standard root filename (e.g. not "d0522_" where 05
specifies the month and 22 specifies the day), then the full
image name must be specified (e.g. "d0522_0044" or
d0522_0044.fits").
- Slit number: the index number of the slitlet to
reduce. You can use the plotmask
utility to determine this number if you only know the name of
the object you want to analyze.
Once the slitlet number and science frames are identified,
clickling the "START" button will set the QuickSlit code on its
way. Any errors which occur in running QuickSlit should result
in text windows appearing on the screen. If QuickSlit runs
successfully, the program will conclude by launching two windows:
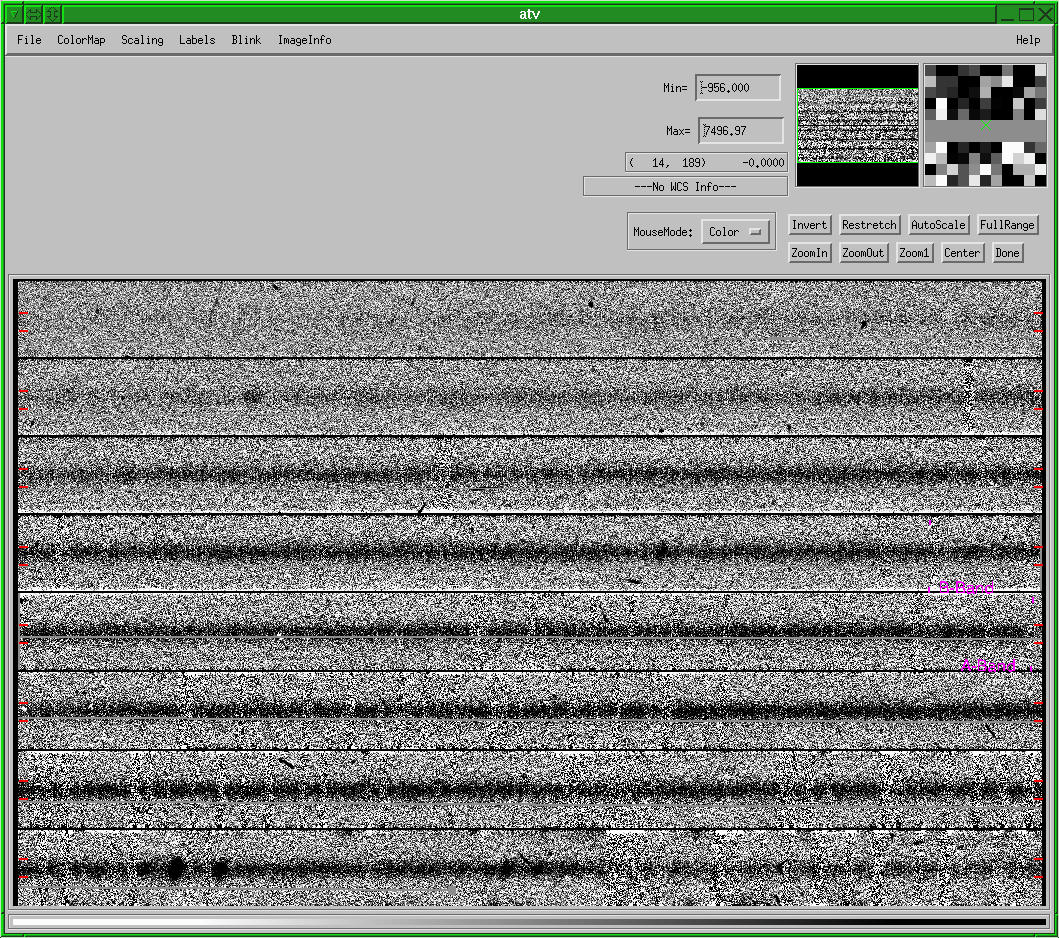
- The atv window displays
the sky-subtracted 2-D image of the slit, sliced into segments
and stacked into a rectangular space so that it can be viewed
in the image display. The spectrum starts at the top left and
continues to the right, then continues on the following line.
You can use the atv tool to pan and zoom to view different
areas of the spectrum and can adjust the contrast, brightness,
and scaling for optimal viewing. Note that in between each
line of the sliced-up spectrum is a single line in which the
pixel values represent the corresponding wavelength (in
Å) for the pixels below that spot. This allows you to
determine the wavelength of a given feature.
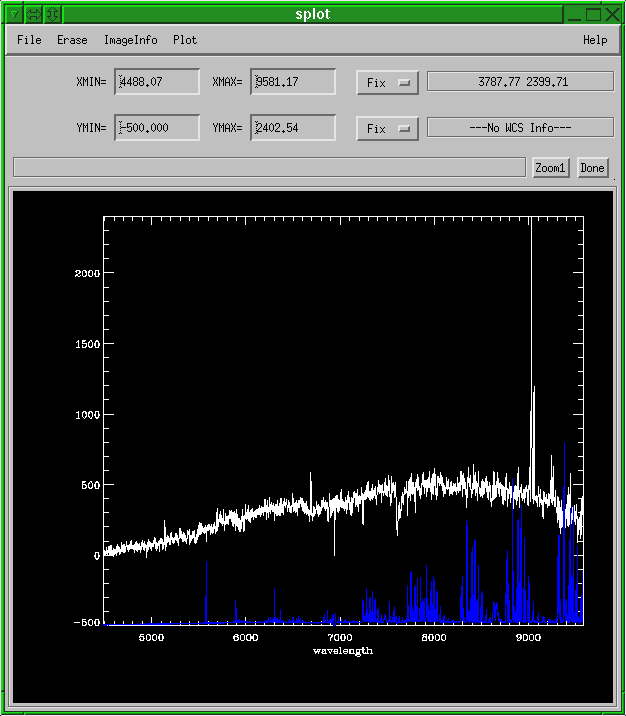
- The splot window shows the
extracted spectrum of the main object in the slit. The target
spectrum is in white and the sky spectrum is shown in blue.
Acknowledgement
The QuickSlit tool was designed by Michael Cooper at
UC-Berkeley with inspiration and encouragement from Greg
Wirth at Keck.
See Also