|
Grism |
Dispersion |
Efficiency | Wavelenth Range (Å) | Flat Field | FWHM resolution for 1" slit (A) |
|
|---|---|---|---|---|---|---|
| MOS | Longslit | |||||
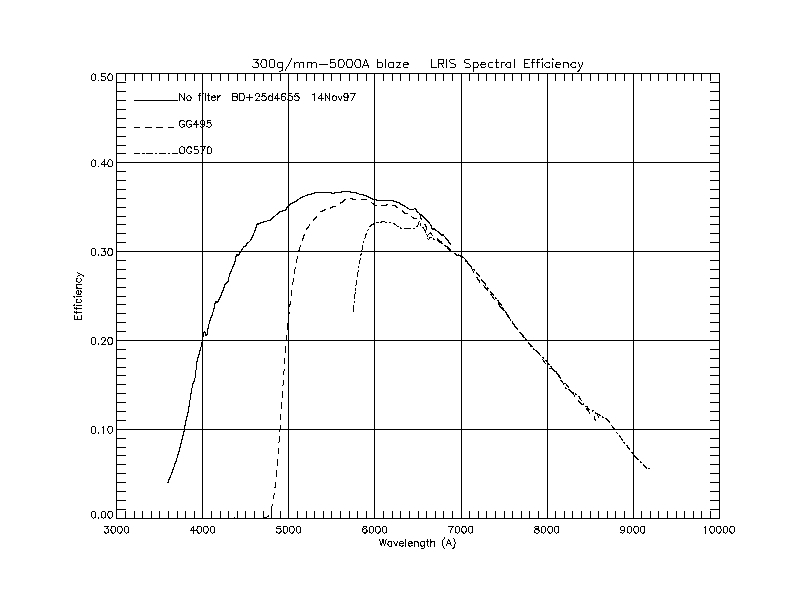
| 300/5000 | 1.43 | data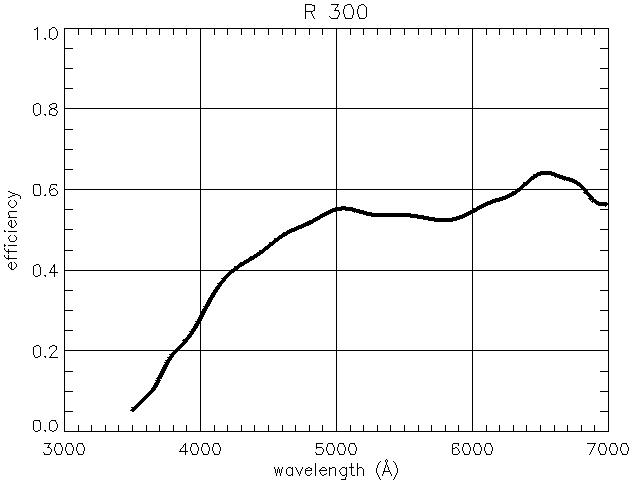 |
2240-8090 | 1600-7450 |
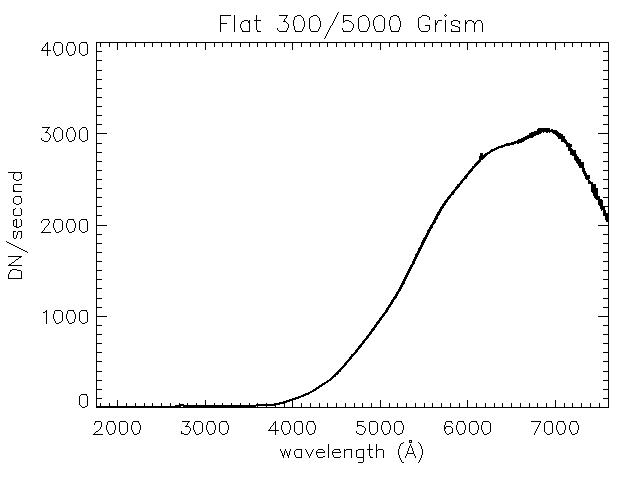
|
8.4-9.2 |
| 400/3400 | 1.09 | data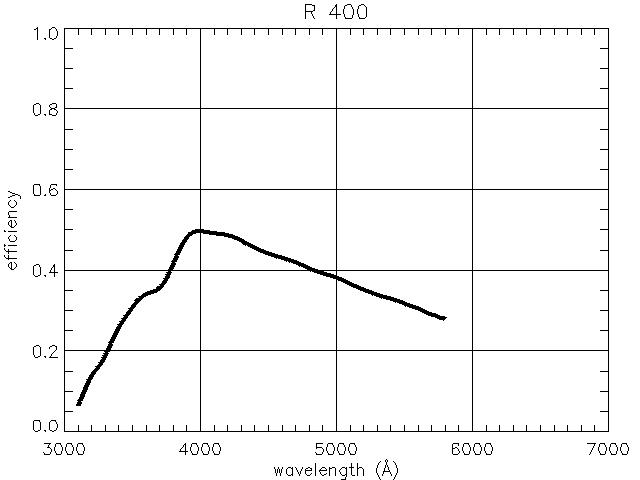 |
1790-6250 | 1300-5770 |
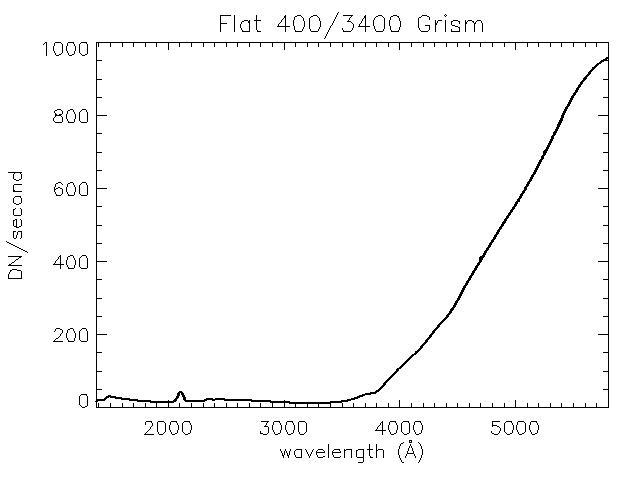
|
6.5-7.1 |
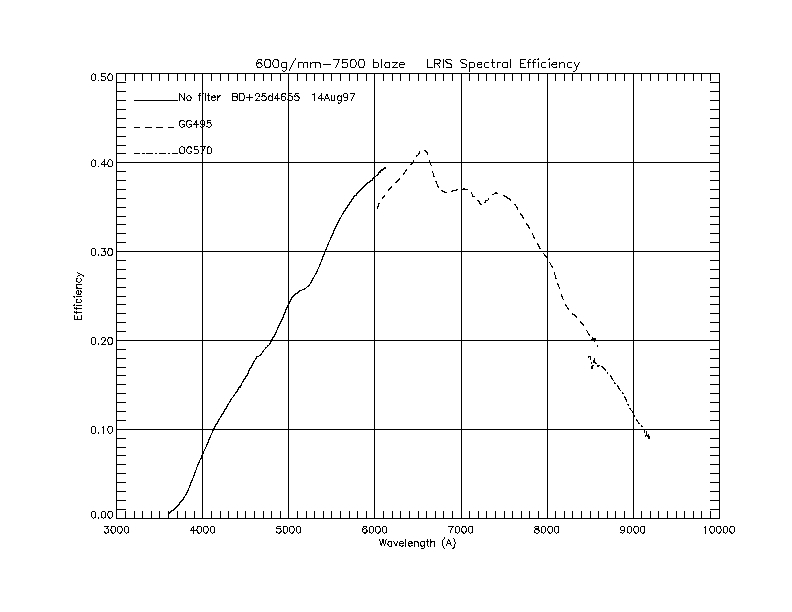
| 600/4000 | 0.63 | data |
3330-5910 | 3040-5630 |
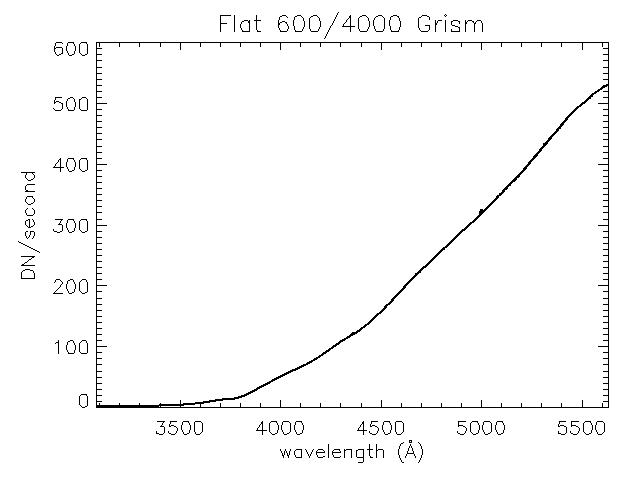
|
3.8-4.1 |
| 1200/3400 | 0.24 | data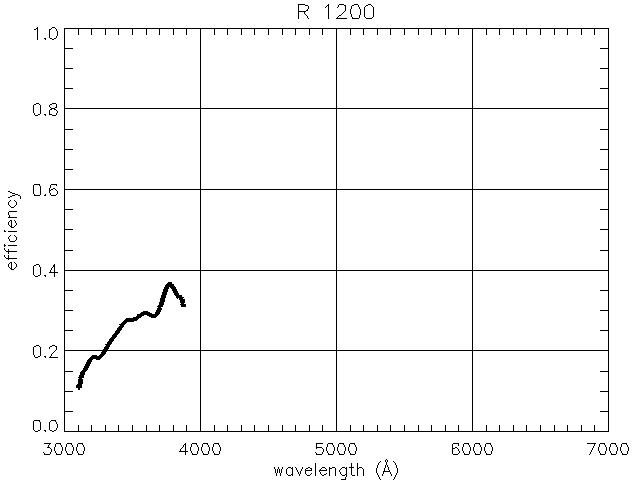 |
3040-4030 | 2940-3920 |
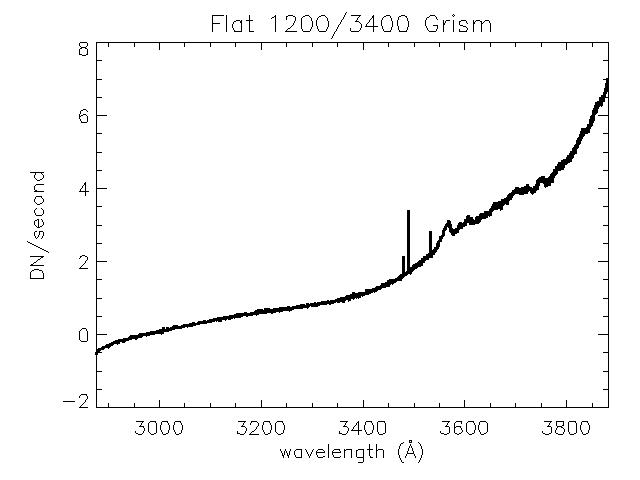
|
1.56 |
Note: The efficiency data was acquired by Chuck Steide (4 June 2002). The efficiency plots reflect the efficiency of LRISb with each grism. For the 300, 400, & 600 grisms, the mirror was used at the position of the dichoric. The UV response improves with the use of dichroics instead of the mirror. The 1200 grism efficiency is in combination with the 460 dichroic. All other optics were the same for all grism observations. Below is a comparison plot of the instrument throughputs for the four grisms as measured by Chuck Steide (4 June 2002)

Gratings: Red Side
The following gratings are available for use with LRIS red side. The grating information is up to date for the red side upgrade. Dispersion and wavelength coverage are calculated and are not measured values. The efficiency plots are not up to date and were determined using the old detector.
|
Grating |
Dispersion |
Efficiency1 | Δλ (Å) | Flat Field | FWHM resolution for 1" slit (Å) |
|---|---|---|---|---|---|
| 150/7500 | 3.0 |
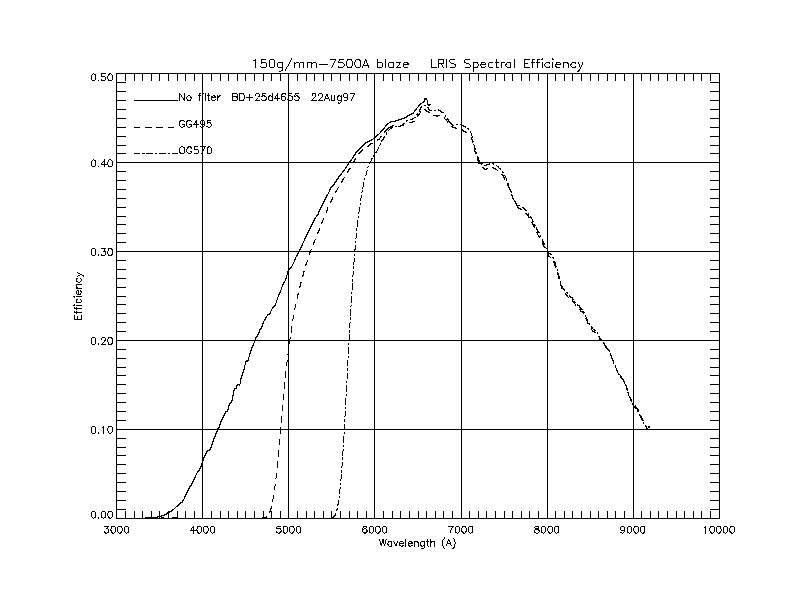
|
12288 | n/a | |
| 300/5000 | 1.59 |
|
6525 | n/a | 9.18 |
| 400/8500 | 1.16 |
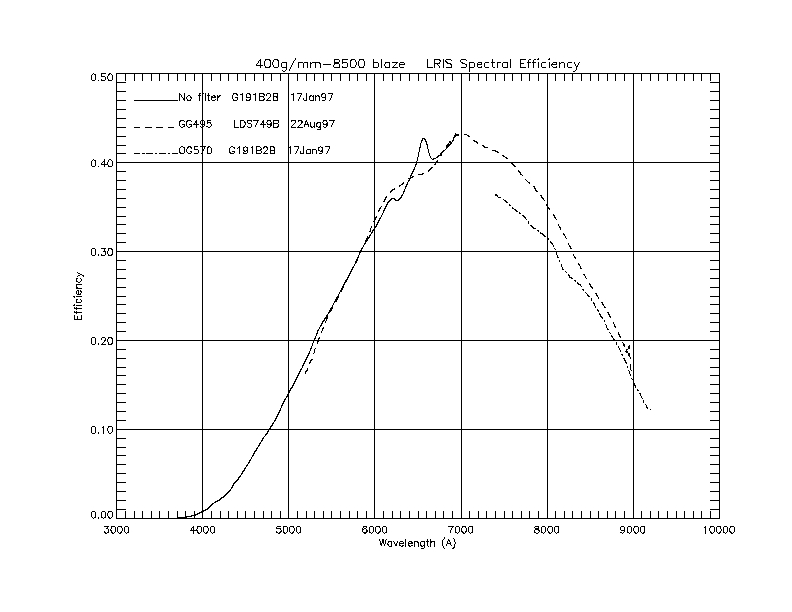 |
4762 | n/a | 6.9 |
| 600/5000 | 0.80 |
 |
3275 |
 |
4.7 |
| 600/7500 | 0.80 |
 |
3275 |
 |
4.7 |
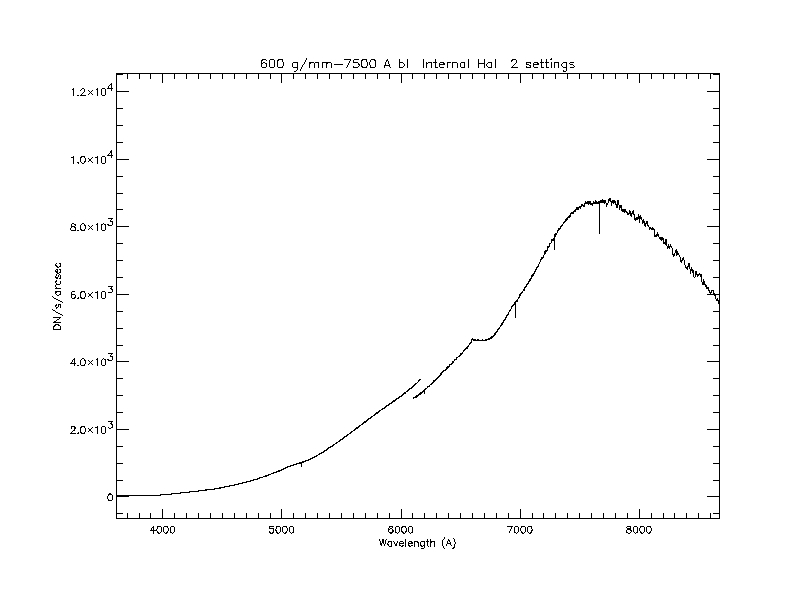
| 600/10000 Gold coated |
0.80 |
 |
3275 |
 |
4.7 |
| 831/8200 Gold coated |
0.58 |
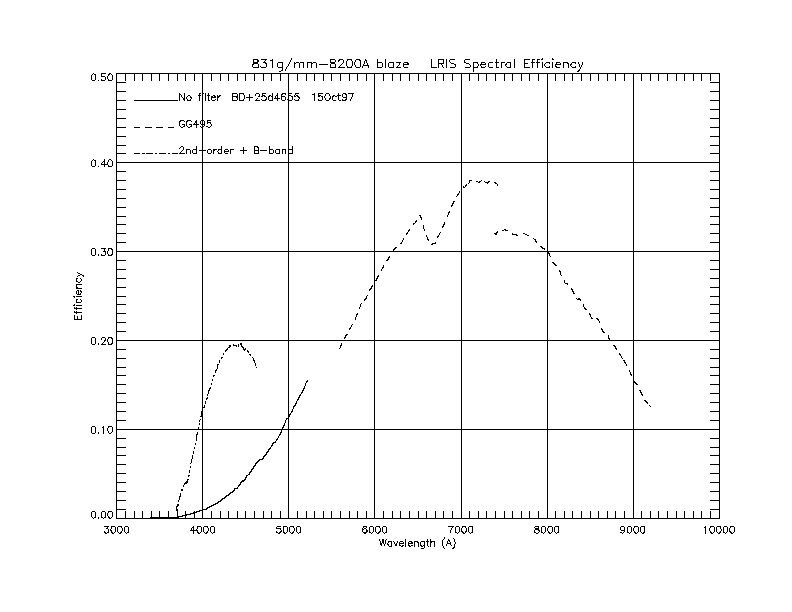 |
2375 | n/a | |
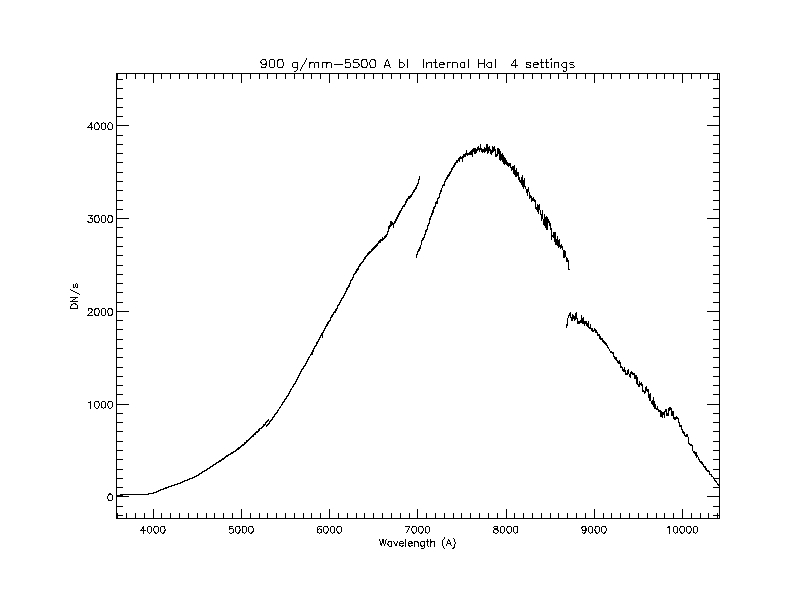
| 900/5500 | 0.53 |
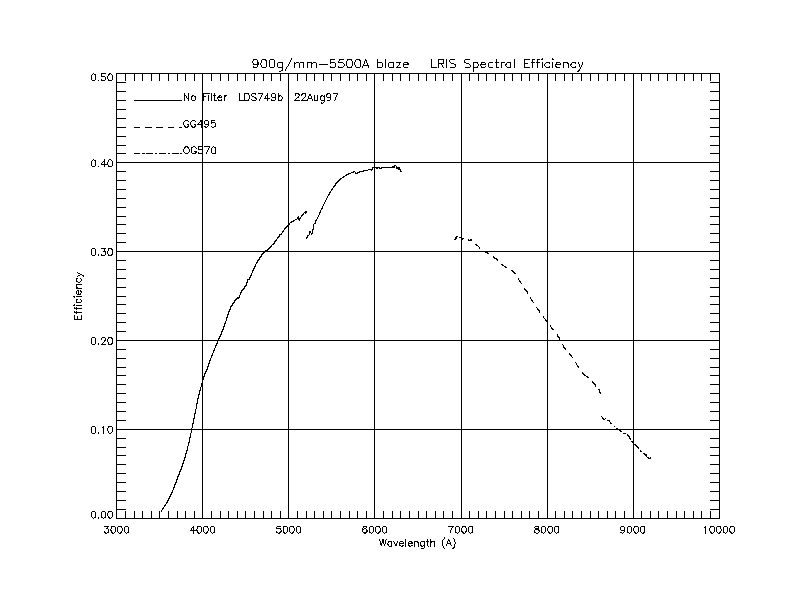 |
2175 |
 |
|
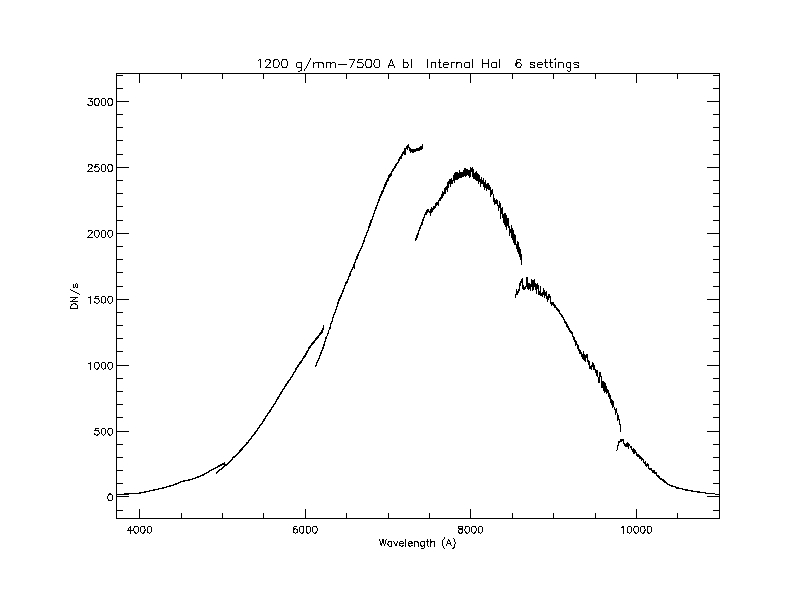
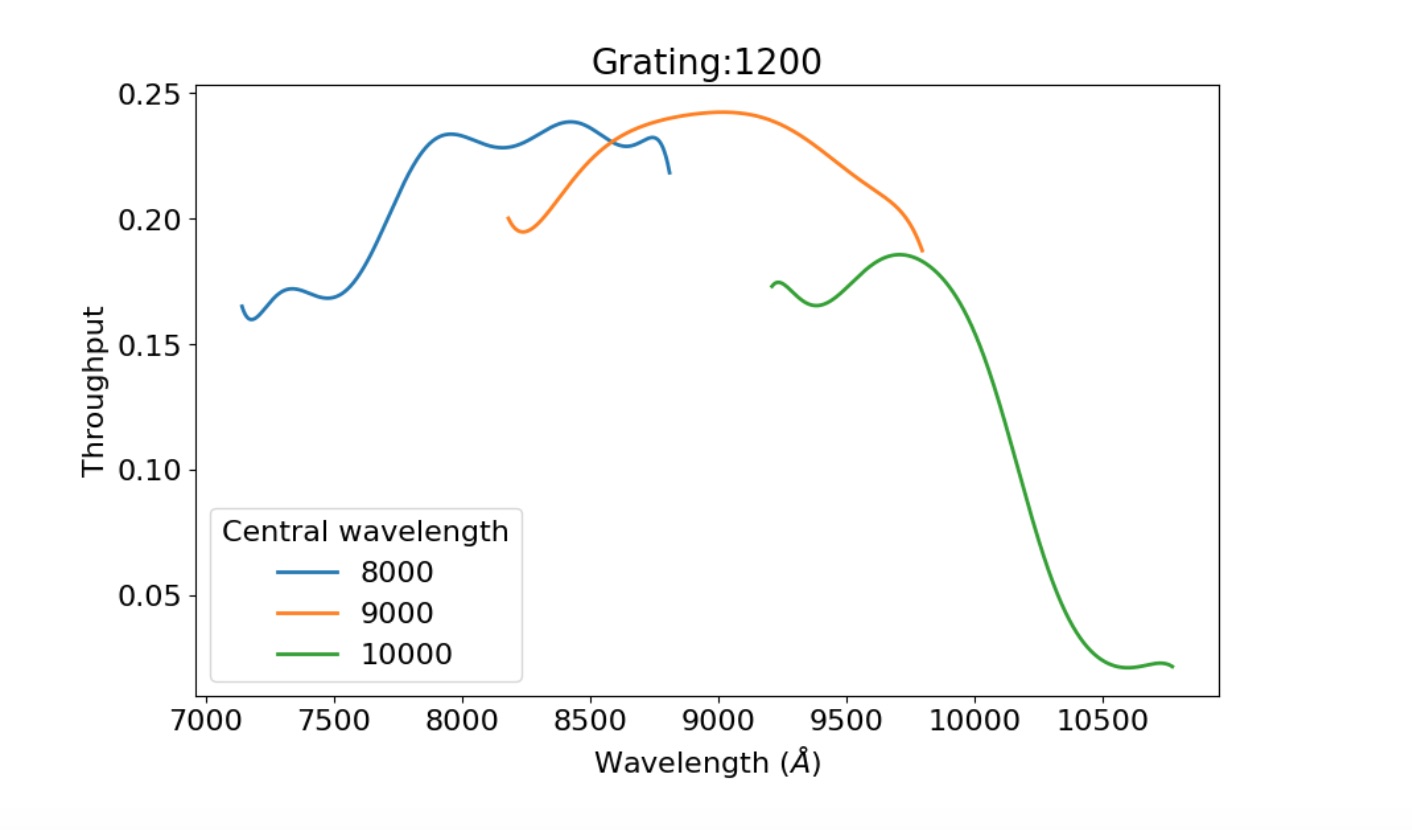
| 1200/7500 | 0.40 | 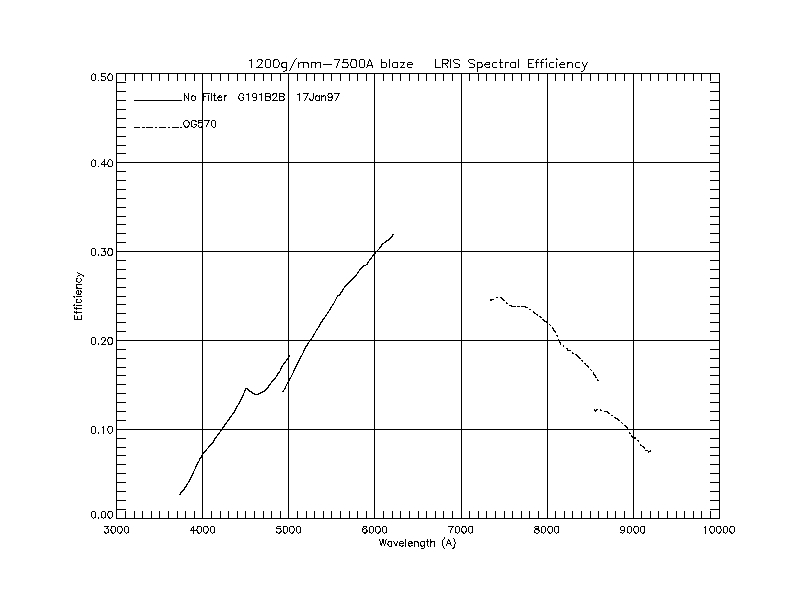 |
1638 |
 |
|
| 1200/9000 Gold coated |
0.40 |
|
1638 | TBD | |
| Mirror | n/a | 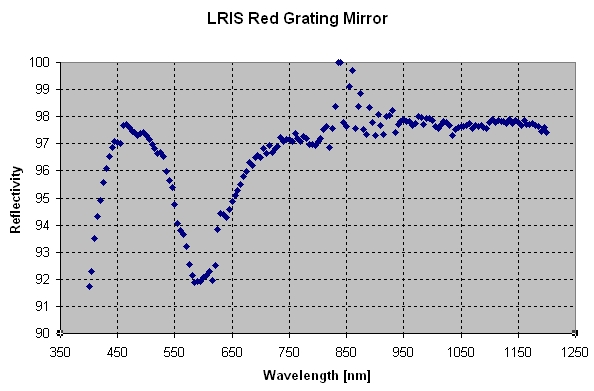 |
n/a | n/a |
1. The grating efficiency was measured by acquiring slitless spectra of spectrophotometric standard stars. The grating, standard star, date of observation, and filter(s) used are indicated on the plots. The spectra were reduced as follows:
- Bias subtraction of stellar spectrum and calibration images.
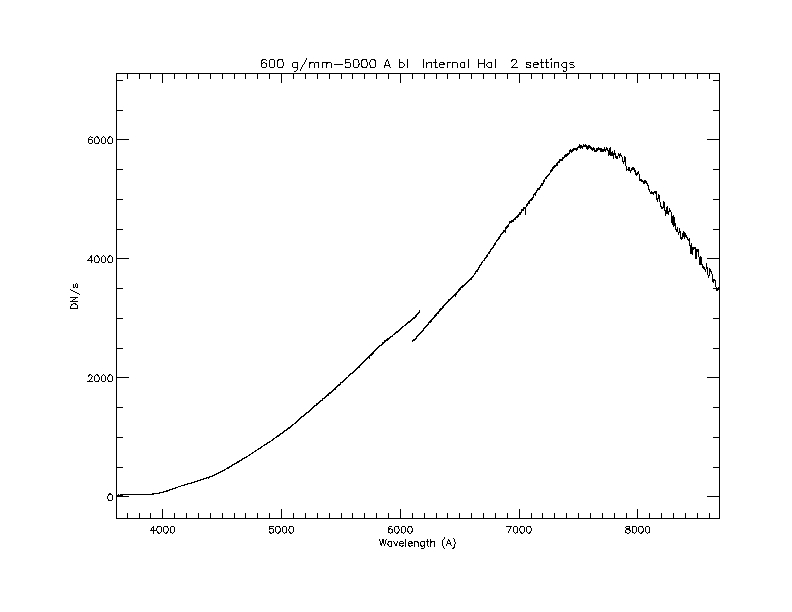
- Flat-fielding of stellar and arc-lamp spectrum images; the flat-field images were taken with internal illumination, generally at the same sky-PA as the stellar spectrum.
- Extraction of stellar spectra with background subtraction; no variance weighting is applied but the spectra have S/N typically greater than 50. The atmospheric A and B-O2 bands, and the H-alpha absorption line when appropriate, are removed.
- The extracted spectra are extinction corrected and integrated over bandpasses from the STScI "medium"-resolution tables (2-10 Å spacing). Then, the spectra are fluxed against the tabulated brightness values.
- The resulting efficiencies are smoothed over 50 Å (typical) centers, and plotted as postscript files.
- The plots for the 600/10000 and 1200/9000 were derived in 2022.
Additional plots for the red side
In addition to the efficiency plots in the table above, several comparative plots between gratings of similar resolution are presented to illustrate crossover points and relative efficiencies.| Low-res gratings |
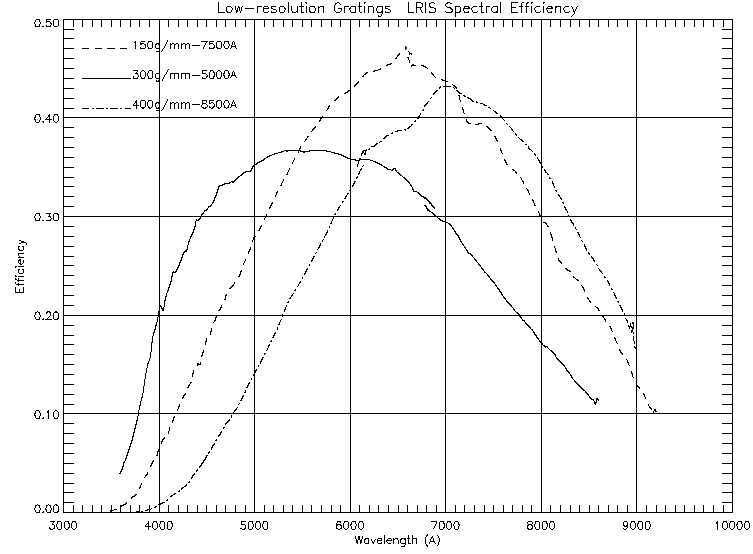 |
| PDF file | |
| Medium-res gratings |
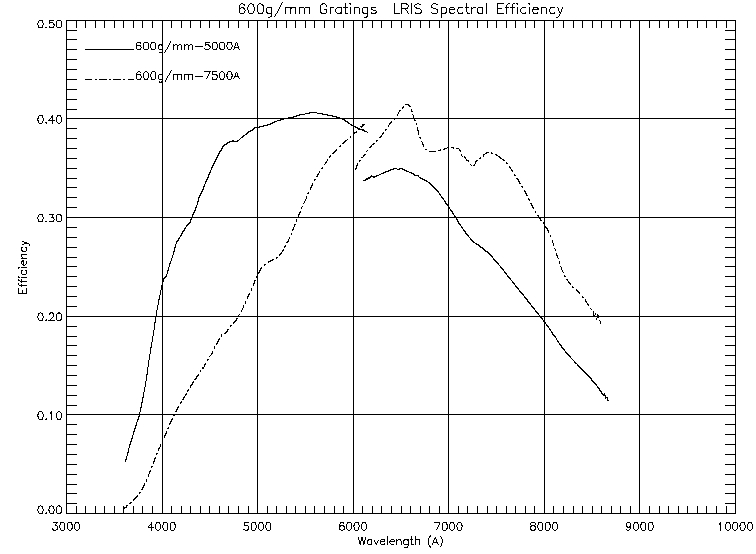 |
| PDF file | |
| Med-res gratings relative efficiencies |
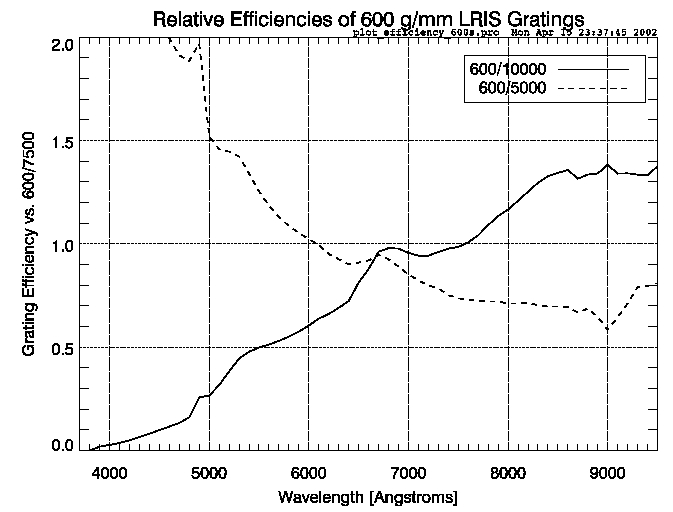 |
| PDF file | |
| High-res gratings |
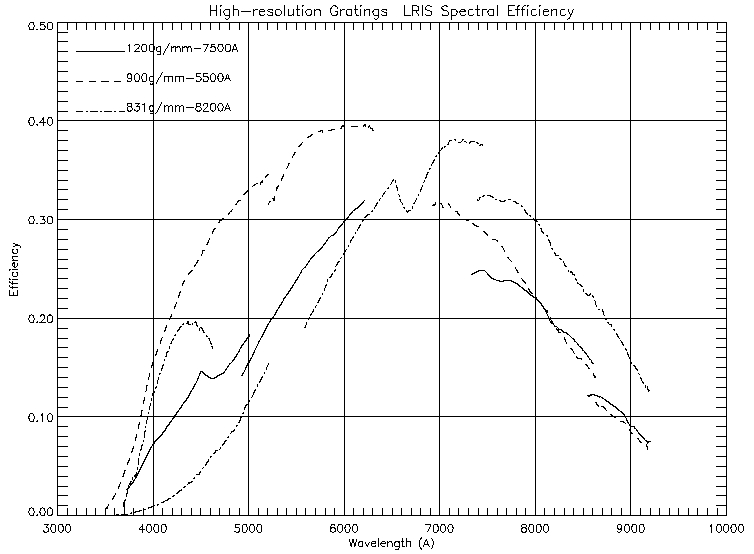 |
| PDF file |
Notes:
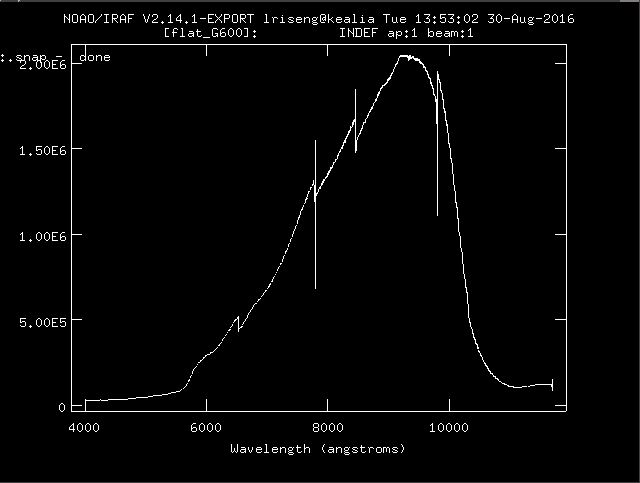
- Several spectra that have overlapping free spectral ranges at the same resolution display an efficiency reduction at the blue end of each progressively red spectrum; see 1200g/mm for example.This effect must be due to a reduced transmission of the CCD over some range of columns on the left side of the CCD (see also Grating flat-field plots).
- Several of the curves (150/7500, 600/7500, and 831/8200) display "enhanced" efficiencies near 6500 Å; in the case of 600/7500 it is seen also in the flat-field plot and is apparently due to a grating ghost. In addition 1200g/mm has a ghost at 4500 Å of similar nature.
- More data exists beyond 9200 A but these tables end there. The spectrum 400g/mm-8500 Å blaze with GG495 was not flat-fielded.