This document describes the DEIMOS Flexure Compensation System (FCS)
graphical user interface, which can be seen in the following figure:
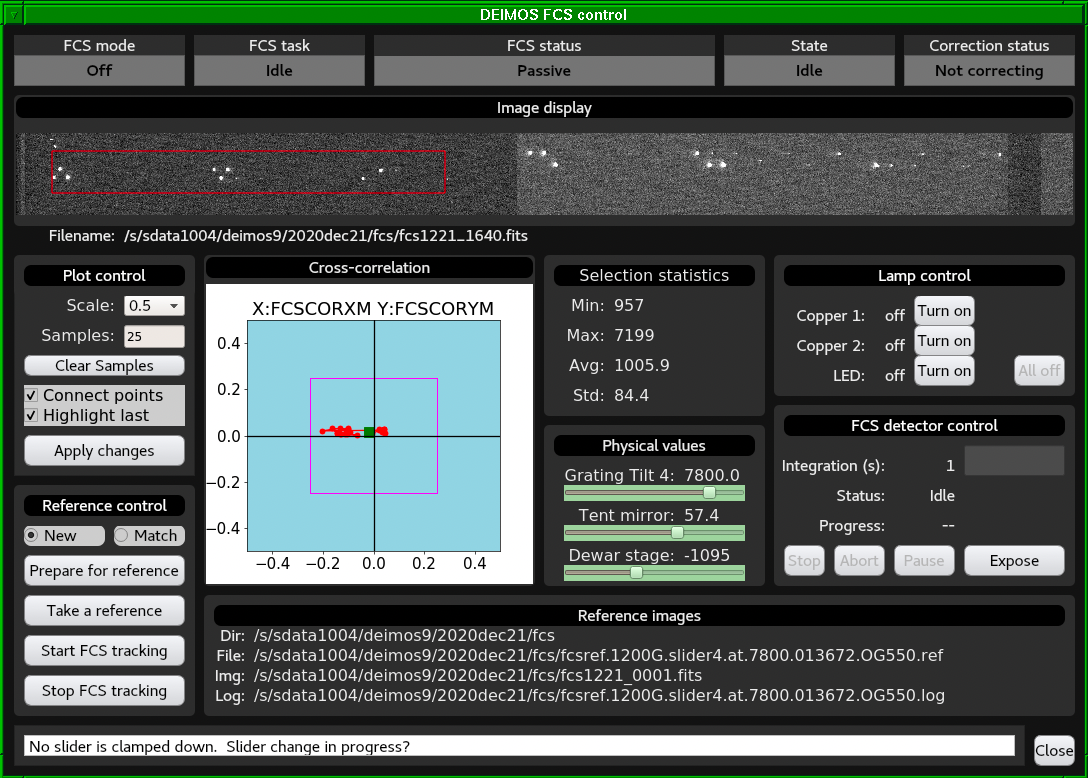
DEIMOS FCS GUI
The GUI is divided in different panels or areas:
FCS status flags: Show the status of different components
of the FCS tracking loop, which is controller by
the fcstrack running behind the scenes. The most
important flag is the FCS status, which is determined as
a combination of the FCS mode, task, state and correction
status. The FCS status must be Tracking before an
science spectral exposure can be started. The The FCS status
must be Tracking while an on-sky spectral integration
is ongoing.
FCS image display area: Display and analyze FCS images in
real time. One can right-click and drag on the image to
draw a rectangular region that will be used for statistical
analysis.
Plot control area: Control cross-correlation plot
parameters such as zooming (Scale), number of past
cross-correlation values to display (Samples) and whether to
connect the cross-correlation values or not. Use the Apply
changes button to make the changes effective.
Cross-correlation plot: Monitor the FCS cross-correlation
value between the current FCS image and the reference image. The
green square symbol shows the current cross-correlation
value. The red circular symbols show past cross-correlation
values. The purple box shows the region within which the
cross-correlation value must be for the FCS status to
be Tracking. No on-sky science spectral exposure must
be initiated unless the FCS status is Tracking.
Selection statistics: Show statistics for the rectangular
region selected on the FCS image display area. The maximum value
in an area containing FCS spots should be larger than 2000
counts to ensure that the cross-correlation signal is high
enough for a robust flexure correction.
FCS stage physical values: Monitor the position of the
stages that provide the flexure compensation. The indicator
color will change from green to yellow and to red depending on how
close a stage is to its travel limit. The grating tilt and tent
mirror work together to compensate the flexure in the spectral
direction. The dewar stage compensates the flexure in the
spatial direction.
FCS lamp control: Control the FCS lamps. This is hardly
used, because the lamps are normally handled automatically by
the fcstrack script, which manages the flexure
compensation system behind the scenes.
FCS detector control: Take FCS individual exposures. This
is rarely used, except for resetting the FCS integration time
before taking a reference image.
Reference control: This area is used to take FCS
reference images. It contains the following buttons:
New/Match radio buttons: Select whether you want to
take a new FCS reference frame or to take a reference frame
matching a reference taken on a previous date.
Prepare for reference: Re-center the FCS control
stages and rotate to -30deg, if needed.
Take a reference: Take an exposure to record a FCS
reference image.
Start FCS tracking: Once you are happy with the FCS
reference image for the current optical configuration
(combination of grating, central wavelength, filter and
focus), you can start the FCS tracking loop.
Stop FCS tracking: Stop the FCS tracking loop. This
is something that you would typically do at the end of an
observing night.
Reference image information: Show the current FCS
directory, FCS reference file, FCS reference image and FCS log
file for the current optical configuration.
FCS logging text box: Show relevant logging information
for the operation of the flexure compensation system.
Close button: Use this button to close the FCS GUI.