DEIMOS Spectroscopic Performance

Background

To assist prospective DEIMOS observers in preparing for their runs, the DEEP2 team has generously shared information on the signal-to-noise ratio (S/N) achieved in their survey. The table and plot below report the measured S/N for a sample of 50,000 distant galaxies as a function of the source brightness. Observers wishing to estimate required exposure times to achieve a given S/N on marginally resolved objects with DEIMOS will find this information beneficial.

Plot

Plot of S/N as a function of R mag

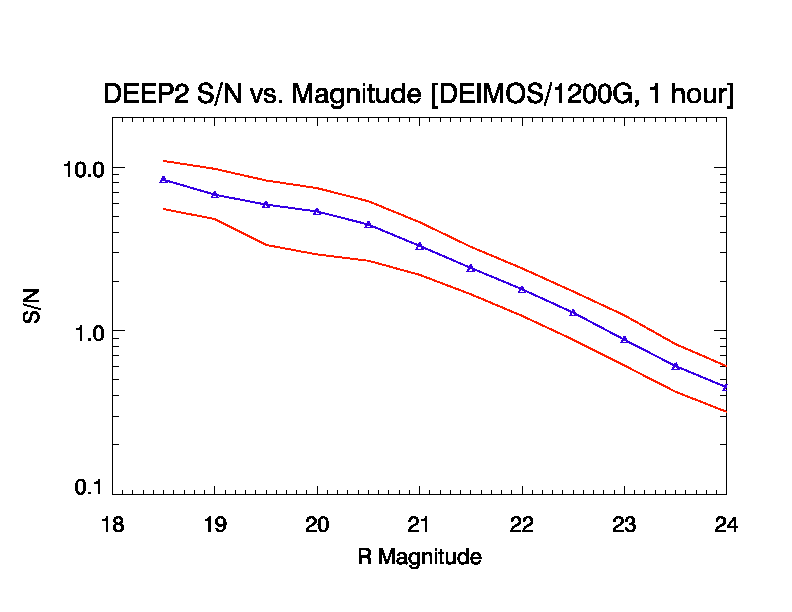
The blue line indicates the median S/N within each 0.5 mag bin as a function of the R magnitude. The red lines denote the interquartile range at each magnitude. The S/N is measured per pixel in a 1-hour exposure with the 1200G grating on DEIMOS, within the wavelength ranges 6600-6830 Å and 6960-7250 Å (to avoid sky lines). The R magnitude is measured on the AB system as described in Coil et al. 2004.

Table

The following table shows the same data in tabular format.

R(AB) S/N per pixel in 1 hour
Q1 Median Q3
18.5 5.53 8.37 10.89
19.0 4.81 6.77 9.74
19.5 3.34 5.89 8.28
20.0 2.92 5.35 7.43
20.5 2.67 4.45 6.18
21.0 2.19 3.29 4.60
21.5 1.67 2.42 3.25
22.0 1.23 1.79 2.40
22.5 0.88 1.29 1.73
23.0 0.61 0.88 1.24
23.5 0.42 0.61 0.83
24.0 0.32 0.45 0.61

Acknowledgement

Michael Cooper of the DEEP2 Survey Team kindly provided the raw data for the plot.
Last modified: 07/10/2020 05:20
Send questions or comments to:DEIMOS Support

The information on this page is the property of the W. M. Keck Observatory. The contents of this page or any part thereof shall not be copied or otherwise reproduced or transferred to other documents or used or disclosed to others for any purpose other than observing support at the W. M. Keck Observatory and the subsequent analysis and publication of scientific data obtained from observations conducted at the W. M. Keck Observatory. All rights reserved. © W. M. Keck Observatory.