• Non-AO Image Quality measurements:
The Image Quality statistics presented here are based on the images taken during 2005-2006 campaign (Jan 2005 through Oct 2006).
The images were
obtained at the Bent Cassegrain foci of the Keck telescopes with the star-stacking
cameras. The optical configuration of each of these cameras contains a field
lens and a focal reducer providing good imaging performance across the field
of view of 0.35 sq. arc minutes. The spectral bandwidth of the cameras is about
100 nm centered at 650 nm.
The calculated image FWHM were corrected to zenith (by sec(z)^0.6, where z is
the zenith angle). All the images were taken after correction for errors in
telescope collimation (focus and coma). Small stacking errors (alignment of
all individual segment images to a single image) might contribute to the total
image sizes shown below.
• Image Quality Statistics:
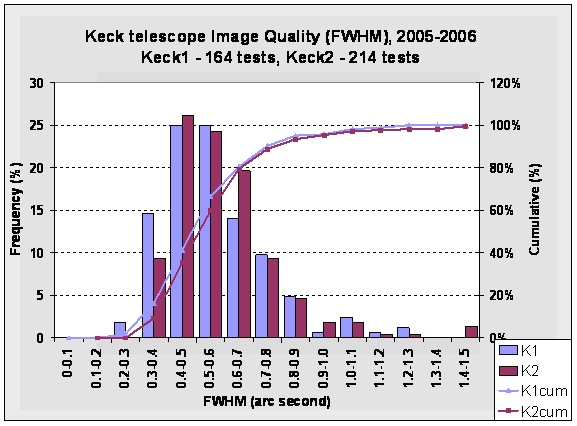
There were 164 tests performed on the Keck 1 telescope and 214 tests
on the Keck 2. Most of the tests were performed between 4 am and 6 am HST.
The following table shows the median image sizes (FWHM) and the percentage of
tests with image sizes less then 0.7 arc seconds in 2005 and 2006.
Median
FWHM |
%
with FWHM < 0.7 arc second |
|||
Year |
K1 |
K2 |
K1 |
K2 |
2005 |
0.548 |
0.589 |
79.0 |
79.0 |
2006 |
0.533 |
0.498 |
82.6 |
80.3 |
| Total |
0.534 |
0.558 |
80.5 |
79.5 |
The figure below shows the distribution of image quality for both telescopes.
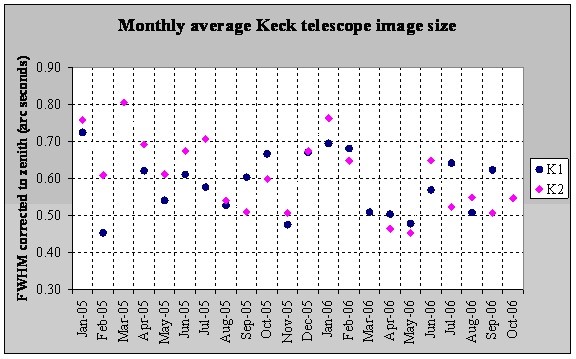
• Seasonal trends:
Because the image quality can be used as a measure of seeing, we also show the month-to-month distribution of the recorded data. The next two figures show a monthly average image size for both telescopes and the data points used to calculate these average values.