Filters
|
Filters |
| Name | Bandpass¹ [µm] | Bandpass 2 Data | |
|---|---|---|---|
| L | 3.5-4.2 | N/A | N/A |
| M | 4.4-5.0 | N/A | N/A |
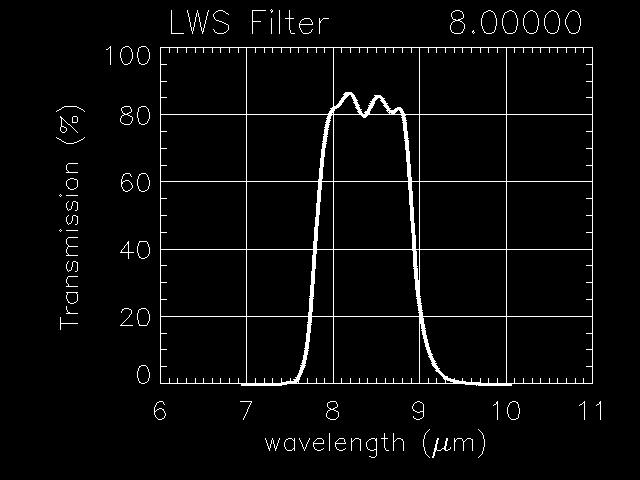
| 8.0 | 7.81-8.94 | plot | table |
| 8.9 | 8.39-9.27 | plot | table |
| 9.9 | 9.67-10.42 | plot | table |
| 10.7 | 9.92-11.47 | plot | table |
| SiC | 10.64-12.96 | plot | table |
| 11.7 | 11.15-12.25 | plot | table |
| 12.5 | 12.01-13.25 | plot | table |
| 17.65 | 17.31-18.16 | plot | table |
| 18.75 | 18.31-19.20 | plot | table |
| 23.1 | 22.74 - 23.47 | plot | table |
| 24.5 | 24.16 - 24.90 | plot | table |
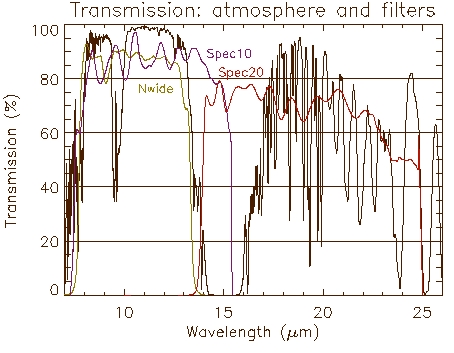
| Nwide3 | 7.73-13.31 | plot | table |
| Spec 10 | >7.52 µm (long pass) | plot | table |
| Spec 20 | >13.93 µm (long pass) | plot | table |