KCWI Throughput

Optical Throughput From Pre-Ship Data

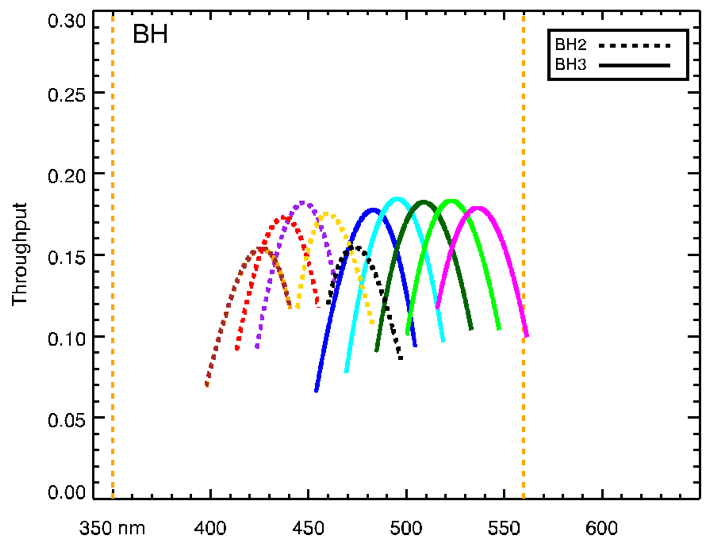
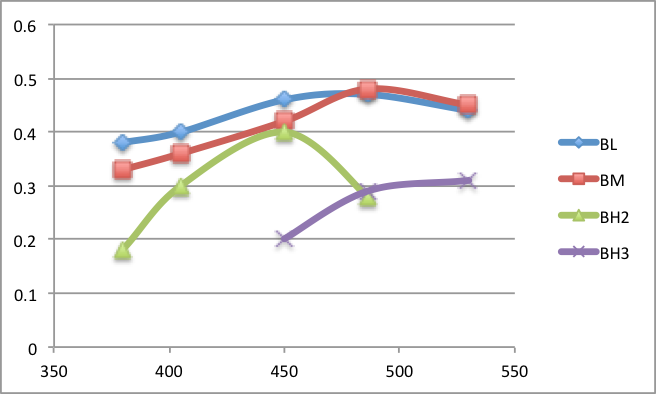
The blue spectroscopic efficiency is summarized in Figure 4: Spectroscopic instrument throughput for the four gratings BL, BM, BH2, and BH3. Does not include telescope and atmosphere.. We note that the small slicer has 5% lower (relative) throughput because of vignetting (unavoidable by design) due the small width of the slices. The instrument throughput meets goal minimum and often achieves the performance goals, except for the BH3 grating, which is underperforming by 25%. Note that for the BH gratings the curve is the superblaze showing the envelope of peak wavelengths for each setting that maximizes the efficiency at that wavelength (typically near but not identical to the central wavelength).

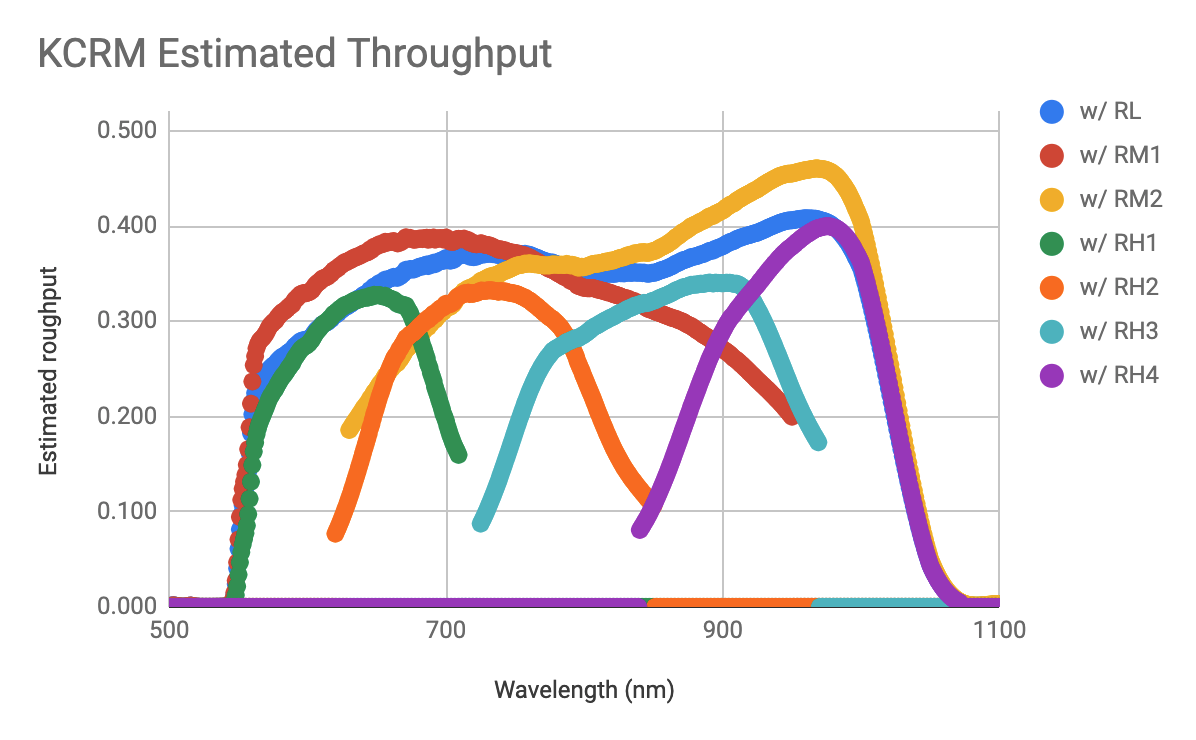
The red SIMULATED spectroscopic efficiency for the 7 red gratings is summarized below. It theoretically includes telescope and atmosphere. The real performance is likely 10-15% lower than the simulation (as was found with the blue side).

Total Throughput From Commissioning Data

Notes on these plots:

  • The curve segments show single instant bandpass
  • Atmosphere is included, but corrected to 1 airmass
  • Telescope response is included (3 reflections)
  • Corrected to airmass 0 and for telescope response, the throughput of the instrument is about 0.2 higher
  • Any observation below 350 nm or above 560 nm require the blocking filter to be retracted

Last modified: 03/16/2023 23:36
Send questions or comments to:KCWI support

The information on this page is the property of the W. M. Keck Observatory. The contents of this page or any part thereof shall not be copied or otherwise reproduced or transferred to other documents or used or disclosed to others for any purpose other than observing support at the W. M. Keck Observatory and the subsequent analysis and publication of scientific data obtained from observations conducted at the W. M. Keck Observatory. All rights reserved. © W. M. Keck Observatory.