Recognizing Dewar Window Condensation from Line Spectra
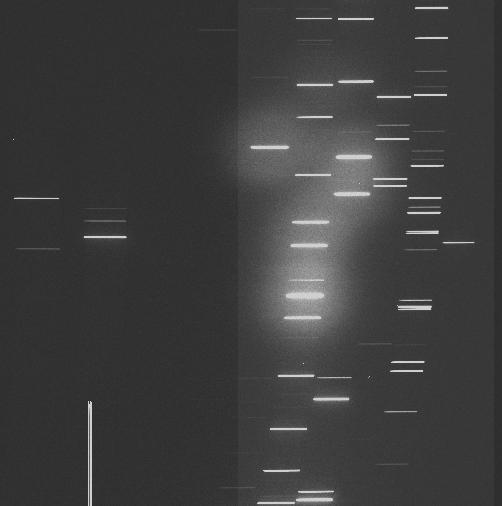
Above is the central part of an ESI echelle-mode wavelength calibration spectrum. At the time condensation had formed on the dewar window. Note the halos around the lines near the center of the detector. Lines toward the edges often will not show this effect, or it will be weaker, since the window tends to fog over first near its center.
|
Popular Links |
|---|