[Å]
(click to enlarge)


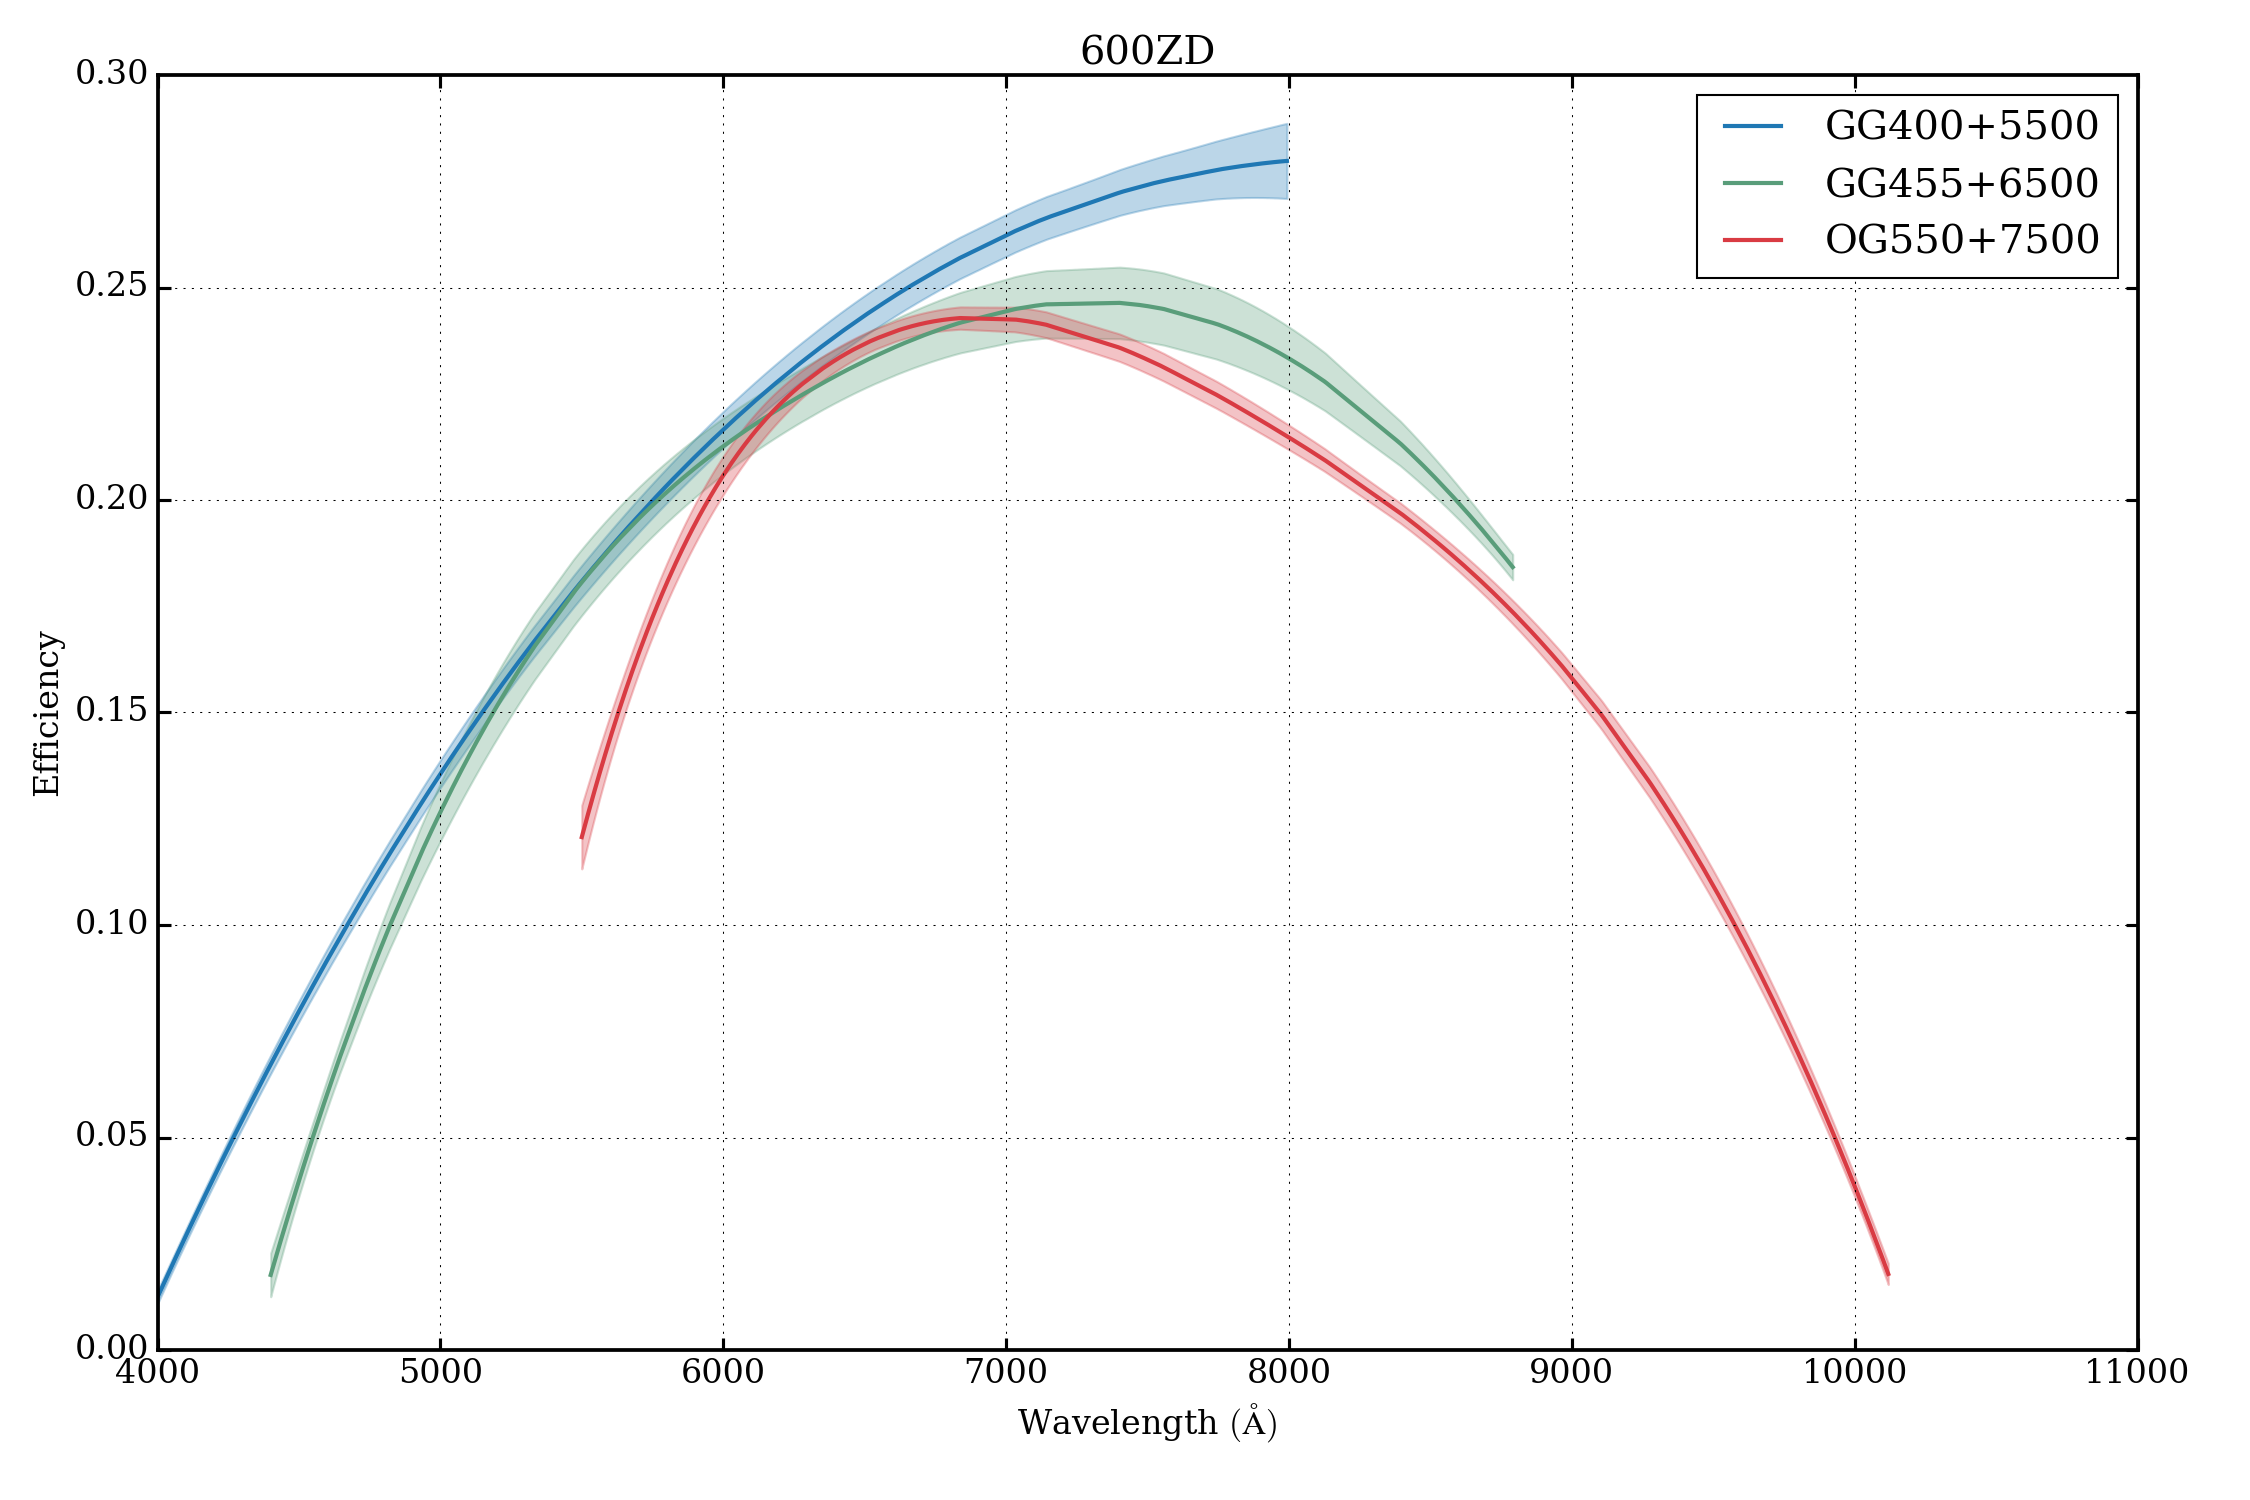
The throughput is defined as:
throughput = Nd/Ntwhere:
| Central Wavelength [Å] |
Plot (click to enlarge) |
Download | Filter | Table |
|---|---|---|---|---|
| 5500 |
|
PNG | GG400 | Table |
| 6500 |
|
PNG |
GG455 | Table |
| 7500 |
|
PNG |
OG550 | Table |
| All |
|
PNG |
-- | -- |
| Central Wavelength [Å] |
Plot (click to enlarge) |
Download | Filter | Table |
|---|---|---|---|---|
| 5000 |

|
PNG | GG400 | Table |
| 7000 |

|
PNG |
GG455 | Table |
| 8000 |

|
PNG |
OG550 | Table |
| All |
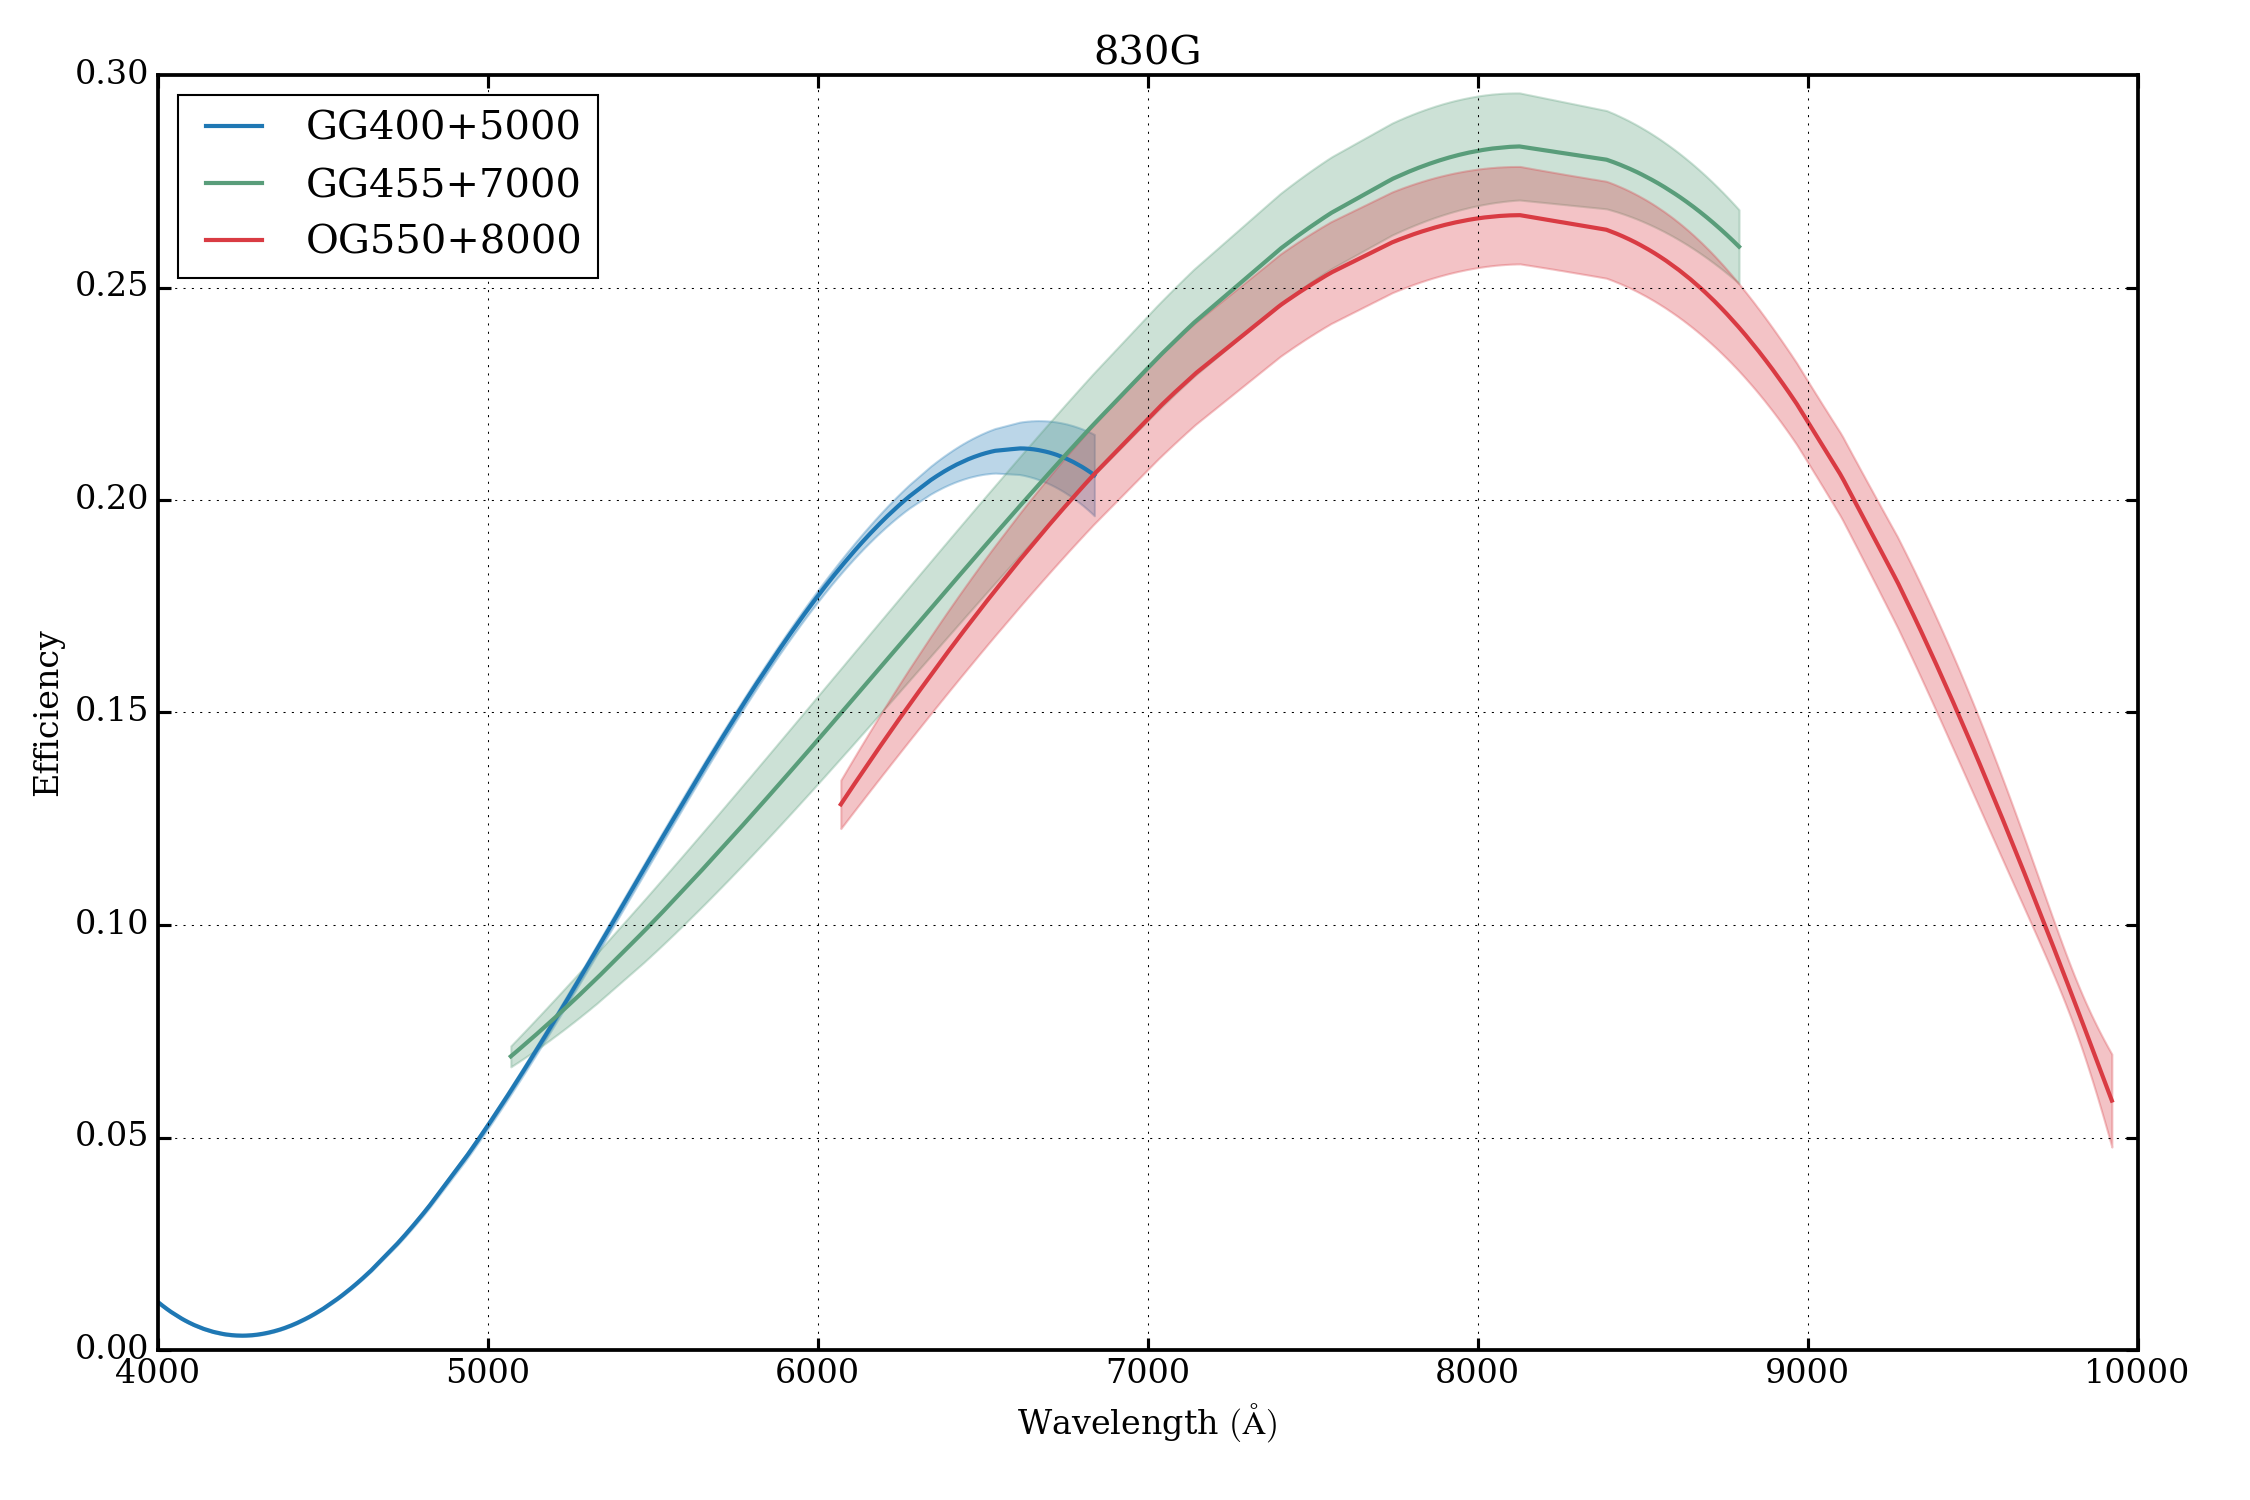
|
PNG |
-- | -- |
| Central Wavelength [Å] |
Plot (click to enlarge) |
Download | Filter | Table |
|---|---|---|---|---|
| 5000 |

|
PNG | GG400 | Table |
| 7000 |

|
PNG |
GG455 | Table |
| 8000 |

|
PNG |
OG550 | Table |
| All |
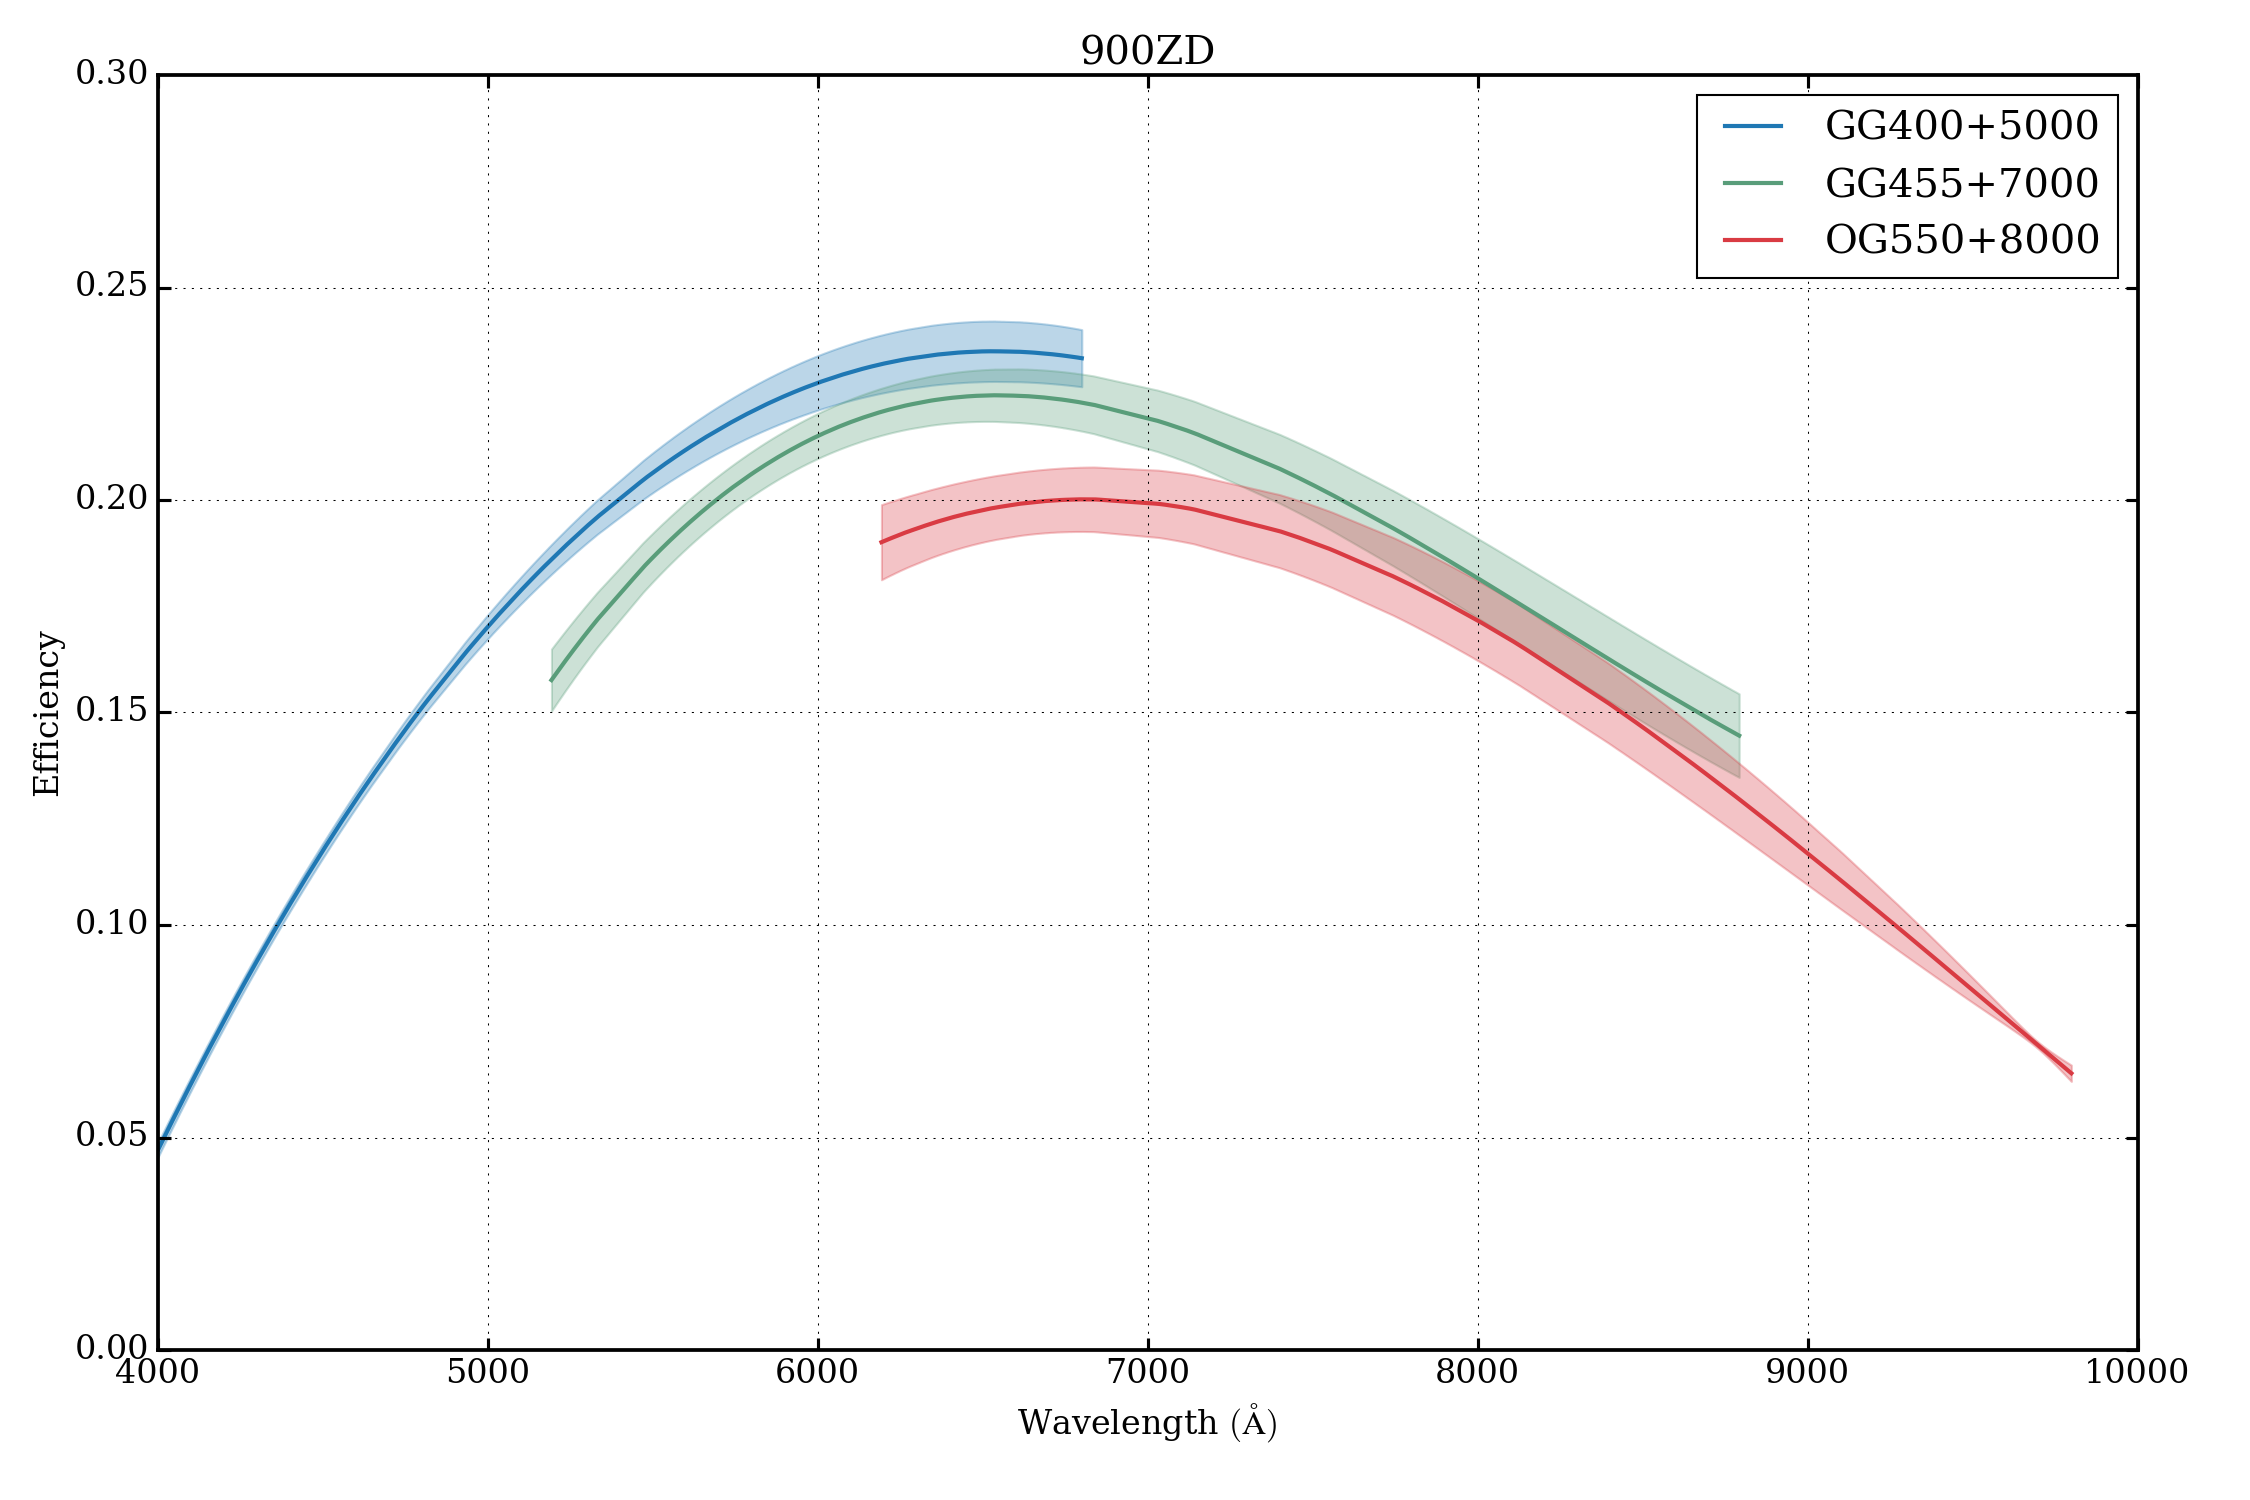
|
PNG |
-- | -- |
| Central Wavelength [Å] |
Plot (click to enlarge) |
Download | Filter | Table |
|---|---|---|---|---|
| 5000 |

|
PNG | GG400 | Table |
| 7000 |

|
PNG |
GG455 | Table |
| 8000 |

|
PNG |
OG550 | Table |
| All |
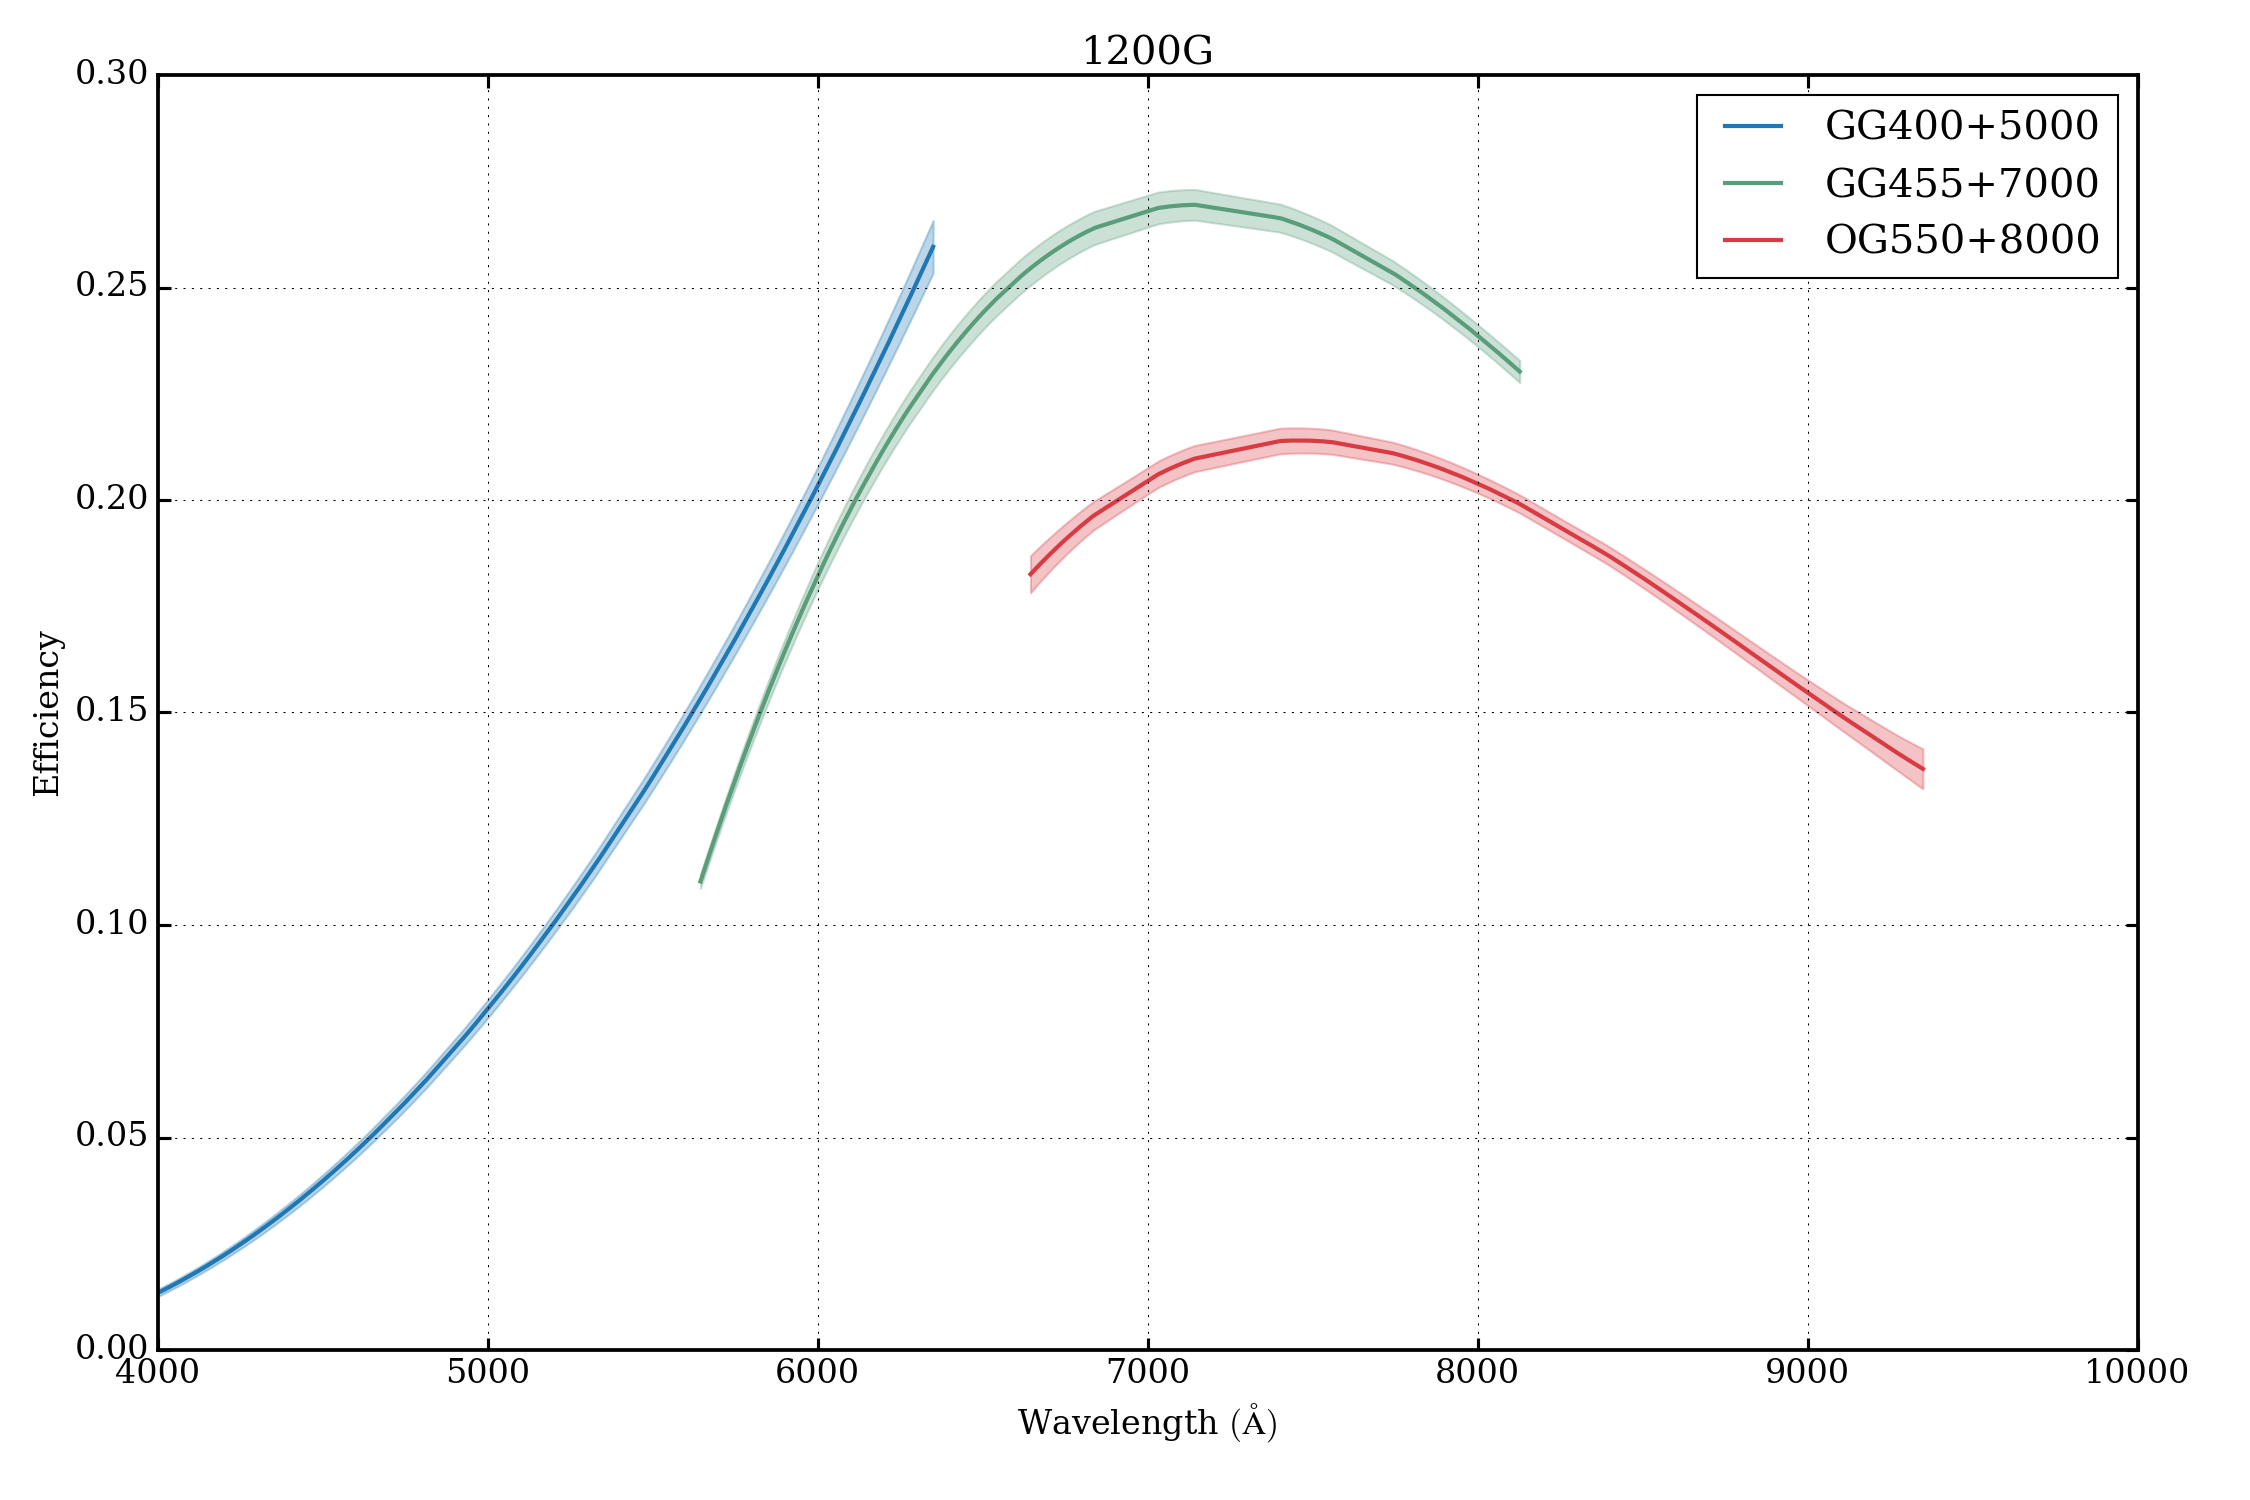
|
PNG |
-- | -- |
| Central Wavelength [Å] |
Plot (click to enlarge) |
Download | Filter | Table |
|---|---|---|---|---|
| 5000 |

|
PNG | GG400 | Table |
| 7000 |

|
PNG |
GG455 | Table |
| 8000 |

|
PNG |
OG550 | Table |
| All |

|
PNG |
-- | -- |