|
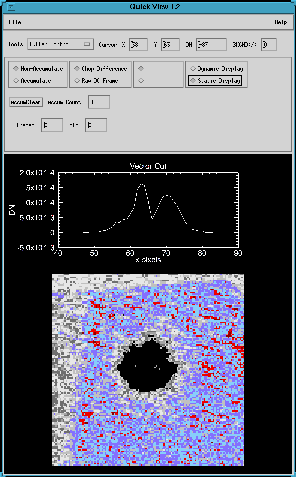
This document provides general overview of Quick View, a
software package for real-time data monitoring on the Long
Wavelength Spectrometer. Version 1.8 is current as of this
document.
Contents
|
- A real-time display tool
- Quick View is a widget-based image display tool that
normally runs in a "dynamic" real-time mode in which it
displays LWS data as they are being saved to the FITS data
cube on disk. Data can be displayed as undifferenced (raw)
images, chop-differenced images, or as the "double-difference"
of two or more chop-nod sets. The user can adjust
contrast/brightness to enhance image features as desired.
- A data-quality monitor
- Quick View features a real-time background monitor which
informs the observer when the mean signal level is approaching
the limit of the A/D converter. It also displays the number
of frames taken and the number of frames in the image set as
an indicator of progress.
- A data-analysis tool
- Quick View offers useful analysis features including
measurement of image statistics over a user-specified region
of interest, determination of image centroids and sizes, and
line plots along any image vector.
- A telescope control tool
- Quick View offers a Slit Align wizard which simplifies
the process of placing a target on the longslit for
spectroscopy, and a Move Telescope wizard which allows you
to move a target to the image center or to any other desired
position on the detector.
- An offline data display tool
- In addition to viewing real-time data, Quick View can
open and examine any LWS image on disk. Since the FITS
images written with LWS are 6-dimensional, this can be the
easiest way to view the chop-differenced image.
The Quick View window includes four main regions:
- Menubar
- Here you can access the File menu, which allows input of
specific images and certain forms of output, and the Help
menu.
- Top Line
- The Top Line region includes a droplist selector which
defines the currently active tool, as well as current
readouts for image display cursor position, pixel value, and
background level
- Current Tool Propsheet
- Here Quick View displays the interface (property sheet or
"propsheet") for the currently selected tool. The available
tools are described in detail below.
- Graphics
- The graphics region includes the image display and
optional line graphics.
These regions are described in detail below.
The menubar contains the File and Help menus.
The File menu offers the following options:
- Open
- Use this option to select an LWS image from disk. A
popup menu will allow you to specify the filename.
- Print
- Send a copy of the graphics region to the printer.
- JPEG Output
- Save the graphics region in a JPEG file.
- Quit
- Destroy the widget.
The Help menu has two options:
- General Quickview Help
- Displays the general help document for Quick View.
- Current Tool Help
- Displays the help page for the currently-active
tool.

The top line region contains the following items:
- Tools
- This droplist allows you to select the currently active
tool. The default is the Buffer Control tool.
- Cursor X
- When the cursor is in the image display, this shows the
column number at which the cursor lies.
- Cursor Y
- When the cursor is in the image display, this shows the
row number at which the cursor lies.
- DN
- When the cursor is in the image display, this shows the
pixel value at the current cursor position.
- BG%
- This always shows the current background level as a
percentage of the range of the A/D converter or the start of
the detector's non-linear regime, whichever is lower. When the
level reaches 100%, the A/D converter is saturated (i.e.,
the counts per pixel exceed 4096 DN) OR the linearity limit
has been exceeded.
- PK%
- This always shows the maximum pixel
value (bad pixels excluded) as a percentage of the range of
the A/D converter or the start of the detector's non-linear
regime, whichever is lower. When the level reaches 100%, the
A/D converter is saturated (i.e., the counts per pixel exceed
4096 DN) OR the linearity limit has been reached.
- Exposure meter
- The horizontal bar graph indicates the fraction of the
exposure which has been completed.
The content of this region changes depending upon which tool is
currently selected. Please see the description of the various
tools below.
The graphics region displays both the image and optional line
graphics.
- Image Display
- This region lies near the bottom center of the graphics
region and displays the 128×128 LWS image
magnified by a factor of three. The following actions are
noteworthy:
- Moving the mouse within
this window causes the cursor position and signal levels
readouts in the Top Line region to update.
- Clicking and dragging the middle mouse button within
the window will generate a line cut plot along the mouse
path.
- Clicking and dragging the right mouse button will
adjust the contrast and brightness in the same manner as
Ximtool, SAOimage, FIGDISP, etc. Horizontal motion
changes the brightness, and vertical motion changes the
contrast.
- Line Graphics
- The line graphics region occupies the space above the
image window and displays a plot of pixel value vs. pixel
position when you generate a vector plot.
The following tools are available:

The Buffer Control tool determines the type of data that are
displayed in the image region. The following controls are
available:
- Accumulate/non-accumulate
- This radio-button pair controls whether to display only
the current chop pair (non-accumulate) or whether to
co-add continuously (accumulate).
- Chop Difference/Raw DC Frame
- This radio-button pair control whether to display the raw
data only or whether to show the difference of the chop
beams.
- Chop Beam 0/1
- When the Raw DC Frame button is selected, this
radio-button pair controls whether the source beam (0) or
reference beam (1) is displayed.
- Dynamic/Static Display
- This radio button pair controls whether incoming data are
displayed (dynamic) of whether the data currently displayed
are frozen (static). This capability allows you to analyze
an interesting frame without it being overwritten by new
data.
- AccumClear
- This button will reset the accumulator so that the new
image sum will begin with the next image.
- Accum Count
- This counter displays the number of chop sets added
together images in the current displayed image.
- Frame/of
- These two counters display the number of chop sets
completed and the entire number to be taken in the
currently-exposing image.

Photometry mode allows you to characterize the brightness and
signal-to-noise ratio of objects in your images. There are two
ways to define the photometry aperture and associated sky
annulus:
- Click and release the left mouse button on the center of
the object you wish to photometer, and the default aperture
size will be used.
- Click and drag the left mouse button on the object to
define an aperture of any desired radius.
The circular photometry aperture will be displayed in cyan, with
the sky annulus outlined in magenta. The following quantities
are computed and displayed:
- Signal
- The background-subtracted signal within the aperture,
expressed in DN.
- Sky
- The mean pixel value within the sky annulus, expressed
in DN per pixel.
- Area
- The area within the aperture, in pixels. Since the
program performs partial-pixel photometry for small
apertures, this value may not be integral.
- Flux
- The signal within the aperture expressed in units of
Jansky. This accounts for the filter and the exposure time,
but not for airmass.
- S/N
- The peak photometric signal-to-noise ratio of the image.
- R_optim
- The optimal radius at which the interior S/N is
maximized, expressed in pixel units.
A number of controls on the propsheet allow you to manipulate
the photometry:
- Centroiding technique: Select either
Centroid to have the widget automatically center
the aperture by measuring the centroid, or Cursor
XY to position the aperture center manually.
- Obj X/Y: Displays the current pixel coordinates of
the aperture center. You may edit these fields to re-center
the aperture on a specific pixel.
- Buffer: Displays the number of pixels between the
end of the object aperture and the start of the sky
annulus. You can change this value by editing the field.
- Sky Width: Displays the width of the sky annulus
in pixels. If set to a non-positive value, sky subtraction
will be disabled and the signal measured will reflect all
counts within the sky aperture. You can change this value by
editing the field.
- Aperture Radius: Displays the radius of the
photometry aperture in pixels. You can change this value by
editing the field.
- Reset: Changes the aperture radius, buffer width,
and sky annulus width back to their initial values.
- Compute: Re-computes all photometric parameters.
Although parameters are automatically recomputed when you
define an aperture with the mouse, this button is useful if
you have changed the aperture by editing the text fields.

Radial profile mode allows you to characterize the radial light
profile of targets in your images. There are two ways to define
the region of interest:
- Click and release the left mouse button on the center of
the object you wish to photometer, and the default aperture
size will be used.
- Click and drag the left mouse button on the object to
define an aperture of any desired radius.
The circular object aperture (within which the profile is
characterized) will be displayed in cyan, with the sky annulus
outlined in magenta. In either case, automatic centroiding is
enabled to postion the aperture center. The following
quantities are computed and displayed:
- Peak
- The central signal level of the Gaussian curve fitted to
the distribution of signal vs. radius,
expressed in DN.
- FWHM
- The full-width at half-maximum of the fitted Gaussian
profile, expressed
in pixels.
- Sky
- The mean pixel value within the sky annulus, expressed
in DN per pixel.
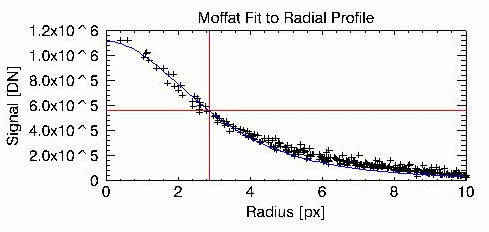
Additionally, the distribution of sky-subtracted signal
vs. distance from the center of the aperture is plotted for all
pixels within the photometry aperture, with the best-fit
curve overplotted in blue and the full-width at half-maximum
displayed via red crosshairs..
A number of controls on the propsheet allow you to manipulate
the photometry:
- Profile type: Select either
Moffat fit the profile with a Moffat function, or
Gaussian to employ a Gaussian in the fit.
- Obj X/Y: Displays the current pixel coordinates of
the aperture center. You may edit these fields to re-center
the aperture on a specific pixel.
- Buffer: Displays the number of pixels between the
end of the object aperture and the start of the sky
annulus. You can change this value by editing the field.
- Sky Width: Displays the width of the sky annulus
in pixels. If set to a non-positive value, sky subtraction
will be disabled and the signal measured will reflect all
counts within the sky aperture. You can change this value by
editing the field.
- Aperture Radius: Displays the radius of the
photometry aperture in pixels. You can change this value by
editing the field.
- Reset: Changes the aperture radius, buffer width,
and sky annulus width back to their initial values.
- Compute: Re-computes all photometric parameters.
Although parameters are automatically recomputed when you
define an aperture with the mouse, this button is useful if
you have changed the aperture by editing the text fields.

Growth curve mode allows you to generate a plot of enclosed
light vs. radius within a circular photometric aperture, and to
measure a true half-light radius. You can define
the region of interest in two ways:
- Click and release the left mouse button on the center of
the object you wish to photometer, and the default aperture
size will be used.
- Click and drag the left mouse button on the object to
define an aperture of any desired radius.
The circular object aperture (which defines the total light)
will be displayed in cyan, with the sky annulus outlined in
magenta. In either case, automatic centroiding is enabled to
postion the aperture center. The following quantities are
computed and displayed:
- Half-light radius
- The size of the circular aperture which contains
half of the total light within the object aperture,
expressed in pixels.
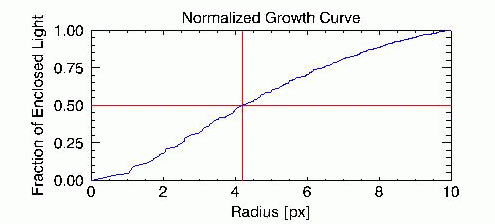
Additionally, the normalized cumulative light within the
aperture is plotted against distance from the aperture center,
with the half-light radius (defined as the point at which the
nornmalized curve of growth first reaches the value 0.5)
indicated via red crosshairs.
A number of controls on the propsheet allow you to manipulate
the photometry:
- Obj X/Y: Displays the current pixel coordinates of
the aperture center. You may edit these fields to re-center
the aperture on a specific pixel.
- Buffer: Displays the number of pixels between the
end of the object aperture and the start of the sky
annulus. You can change this value by editing the field.
- Sky Width: Displays the width of the sky annulus
in pixels. If set to a non-positive value, sky subtraction
will be disabled and the signal measured will reflect all
counts within the sky aperture. You can change this value by
editing the field.
- Aperture Radius: Displays the radius of the
photometry aperture in pixels. You can change this value by
editing the field.
- Reset: Changes the aperture radius, buffer width,
and sky annulus width back to their initial values.
- Compute: Re-computes all photometric parameters.
Although parameters are automatically recomputed when you
define an aperture with the mouse, this button is useful if
you have changed the aperture by editing the text fields.
Note that the photometry is performed using integral pixels,
which limits the accuracy of the growth curve at small radii
(r<3).
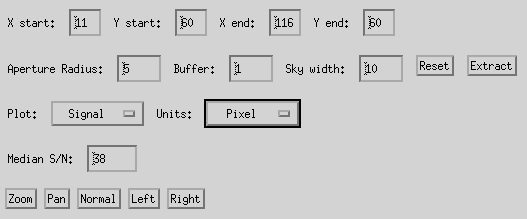
Spectroscopy mode provides the ability to extract and view a
spectrum quickly. Once you define the location of the spectrum,
the spectrum is automatically traced, extracted, and displayed.
You can define the location of the spectrum in two ways:
- Click the left mouse button at one end of the
spectrum and drag along the spectrum (make sure you release
the mouse button while still on the image --- if you go off
the edge, no extraction will occur). The spectral extraction
region will be extended all the way to the left and right
edges of the image, so it isn't necessary to drag all the way
to the edge using the mouse.
- Enter estimates starting and ending coordinates in the
boxes labeled Xstart, Xend, Ystart,
and Yend and click the Extract button.
Once you've defined the spectrum location, QuickView will
attempt to "trace" the spectrum within a window along this
vector. Row centroids are measured at intervals of several
columns (adding columns together along the way) to increase the
S/N of the trace, and the resulting set of centroids is fit by a
line with the data points weighted by flux in order to avoid
biasing by regions with poor continuum flux.
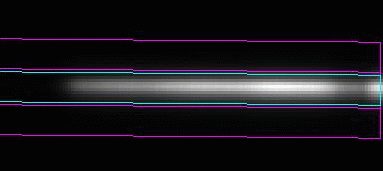
Once the trace has been determined, QuickView will display the
regions it will use to define the "object" region (outlined in
cyan) and the two "background" regions (outlined in magenta)
flanking the object region. Three parameters define the width
and separation of these regions:
- Aperture Radius: Half-width of the extraction box
for the object spectrum, in pixels.
- Buffer: Width of the gap between the outer edge of
the object aperture and the inner edge of the background
aperture, in pixels.
- Sky width: Width of the background apertures
flanking both sides of the object aperture, in pixels.
Two buttons associated with these input fields are useful:
- Reset: restores the aperture width, buffer, and
sky width parameters to their default values.
- Extract: re-traces and extracts the spectrum after
spectrum endpoints or aperture parameters have been edited,
or when a new spectrum has been loaded.
Quickview will use the object and background apertures to
measure the object and background flux at all columns in the
image, and will display the resultant spectrum as a line plot.
The following quantity is computed and displayed:
- Median S/N
- The median signal-to-noise (S/N) value in the spectrum,
derived by dividing the signal at each column by the noise,
estimated using the relationship
noise = sigma*sqrt(n_obj*(1+1/n_sky))
where:
sigma = measured standard deviation of background pixel values in this column
n_obj = number of pixels in the object aperture
n_sky = number of pixels in the sky aperture
This relationship ignores the object flux as a source of
noise; i.e., it assumes that the dominant noise sources are
read noise and Poisson noise from the background flux.
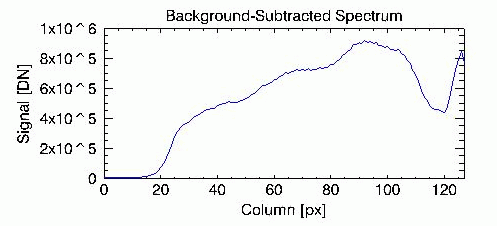
Quickview also will display a line plot in the graphics region
above the image display. The following controls can be used to
control the quantities plotted in the line graph area:
- Plot: this droplist menu gives the following
options for the ordinate:
- Signal: background-subtracted flux within
object aperture
- Raw signal: flux within object aperture, no
background subtraction
- Sky: median background level, per pixel
- Noise: noise in the signal
measurement, estimated using the relationship described
above
- S/N: signal-to-noise ratio
- Trace: measured centroid of the spectrum
(points) and corresponding fit (line) plotted vs. column
number
- Units: this droplist menu provides two options for
the abscissa:
- Pixel: plots ordinate vs. column number
- Wavelength: plots ordinate vs. wavelength,
estimated using the keywords for central wavelength
(CENLAM) and dispersion (LAMPIX)
Quickview automatically redraws the line plot whenever you
change the selected abscissa or ordinate. Once the plot is
drawn, you can look at details in the plot by using the
following controls to select a region of interest:
- Zoom: expands the horizontal scale by a factor of
two
- Pan: contracts the horizontal scale by a factor of
two
- Normal: restores the plot to full frame
- Left: shifts the plot window to the left by half
the width of the frame
- Right: shifts the plot window to the right by half
the width of the frame

The Stats tool allows you to measure simple statistics over a
region of interest which you define in your image. There are
two ways to define the region of interest:
- Click and drag the LEFT MOUSE button to specify a
rectangular region.
- Type starting and ending coordinates directly into the
boxes labeled "X start", "Y start", "X end", and "Y end".
The statistics will be computed and displayed in the fields
described below.
- X/Y Start
- These fields gives the starting row and column for the
rectangular statistics region. You can edit these fields to
change the box endpoints.
- X/Y End
- These fields gives the ending row and column for the
rectangular statistics region. You can edit these fields to
change the box endpoints.
- Minimum/Maximum
- These fields list the minimum and maximum pixel values
within the statistics region, in units of DN.
- Median
- This lists the median pixel value within the statistics
region, a more robust estimator of the central value than
the mean.
- Stddev
- This lists the standard deviation of the pixels values
within the statistics region, a non-robust estimator of the
spread in the data values.
- StdMAD
- This lists the quantity MAD/0.65, where MAD is the
median absolute deviation from the median pixel value.
This corresponds to the standard deviation of a
Gaussian distribution, but is less affected by outliers
(e.g., hot pixels) than the standard deviation.
- Erase Overlay
- Clicking this button will erase the statistics box from
the display. The box can also be erased by clicking and
releasing the left mouse button while in the image display,
or by selecting a new tool.
To dismiss the outline box, you can either:
- Click the "Erase Overlay" button
- Click the left mouse (without dragging) in the image
- Select another property sheet or mode

The FWHM tool allows you to measure object centroids and sizes
by clicking the left mouse button on a target of interest.
Once you've done this, the FWHM tool will report the following
quantities:
- X/Y cent
- These two fields display the row and column center
derived by an analysis of the marginal pixel distributions
in a box around the point where you clicked the mouse
button.
- FWHM (pixels/arcsec)
- These two fields display the image size in units of
pixels and arcseconds. The size returned by the routine is
not, strictly speaking, a true full-width at half-maximum.
It is actually the Petrosian metric radius for eta=0.5,
multiplied by the ratio of FWHM/r(eta=0.5) for a pure 2-D
Gaussian profile. Hence, for profiles which deviate from
purely Gaussian, this will not be a "real" FWHM.

The stretch tool allows you to manipulate the image colormap
using the following items:
- Auto
- If selected, the software will automatically choose the
minimum and maximum pixel values for image display and will
use a simple linear scale.
- Histogram Equalize
- If selected, the software will manipulate the color table
such that approximately equal numbers of pixels lie in each
of the 256 greyscale values. The minimum and maximum are
automatically selected.
- Set Min/Max
- If selected, the values you enter in the Min and Max
boxes are used to determine the image scaling; a linear
stretch is used.
- Min/Max
- When the Set Min/Max button is selected, this pair of
boxes determines the low and high pixel values to be scaled
into displayed values.
- Brightness/Contrast
- With this pair of slider bars you can adjust the image
contrast and brightness.
- Image color table
- Use this selector button to change the default colormap
to reverse video, heat, RGB, etc.

The line plot tool gives feedback on the current vector cut via
the following fields:
- X/Y Start
- These fields gives the starting row and column for the
vector cut. You can edit these fields to
change the vector endpoints.
- X/Y End
- These fields gives the ending row and column for the
vector cut. You can edit these fields to
change the vector endpoints.
- Erase Overlay
- Clicking this button will erase the line vector from
the display.
- Erase Plot
- Clicking this button will erase the line plot above the
image display.

Slit align mode is useful for placing a target onto the slit in
preparation for spectroscopy. To use this mode, do the
following:
- Obtain an image which shows your target. Generally this
is done by placing the datataking system into
Video mode and clicking the button labeled
Src-Ref to display the chop difference.
- Click on the Object button to specify the
target coordinates.
- Select the appropriate coordinate method. Click
Centroid to have the program compute the center
of the object you click on; this option is appropriate for
compact sources at high S/N. Alternatively, click
Cursor XY to avoid centroiding and simply take
the postion of the cursor as the obejct center.
- Move the cursor onto the image of your object and click
the Left Mouse button to define the object
center. The center coordinates should be copied to the
boxes labeled Obj X and Obj Y.
- Now use the XLWS GUI to insert the appropriate LWS slit
into the beam.
- Click the Slit button to specify the slit
center.
- Click the Source button to select the raw
image and make the slit visible.
- Click and drag the Middle Mouse button across
the slit at the location where you would like the object to
land. A vector cut will be plotted and the measured slit
center should appear in the boxes labeled Slit X
and Slit Y.
- Click the Move Telescope button to effect the
move.
- For bright sources, you can click on the
Src-Ref button and adjust the colormap (click and
drag Right Mouse) to see the target in the slit.
- Change to the appropriate grating and filter, and start
taking spectra.

Move Telescope mode is useful for centering targets or moving
them to other desired positions on the array. To use this
mode, do the following:
- Obtain an image which shows your target. Generally this
is done by placing the datataking system into
Video mode.
- Click on the From button to specify the
current target coordinates.
- Select the appropriate coordinate method. Click
Centroid to have the program compute the center
of the object you click on; this option is appropriate for
compact sources at high S/N. Alternatively, click
Cursor XY to avoid centroiding and simply take
the postion of the cursor as the obejct center.
- Move the cursor onto the image of your object and click
the Left Mouse button to define the object
center. The center coordinates should be copied to the
boxes labeled From X and From Y.
- To set the destination coordinates to the center of the
array, simply click the To Center button. To
send the object to any other location, click the
To button to specify the destination
coordinates, select the appropriate centroiding method
(Centroid or Cursor XY), and click
Left Mouse at the destination location.
- Click the Move Telescope button to effect the
move.

FITS Summary mode allows you to inspect the data stored in the
FITS image header. Selecting this propsheet brings up a table
displaying numerous important FITS keywords. Two controls are
provided:
- Update: Click this button to cause the FITS header
to be re-read from the disk image.
- All: Click this button to bring up a new window
containing the full contents of the FITS header.
Go to:
LWS Home Page -
Instruments Home Page -
Keck Home Page
LWS Master
Last modified: Thu May 18 14:39:11 HST 2000


