NIRC2 Instrument and Data Format*
1. Introduction
NIRC2 is a near-infrared instrument designed to take full advantage of the adaptive optics on the Keck II telescope of The W. M. Keck Observatory on Mauna Kea, Hawaii.The Co-PIs are Keith Matthews and Tom Soifer, both of Caltech. The instrument was built by Keith Matthews and engineer Sean Lin of Caltech, with help from James Larkin, Ian McLean, and others at UCLA (detector electronics and related software), and Al Conrad, Bob Goodrich, and Allan Honey at Keck Observatory (software). Support in Waimea was provided by Jim Bell, Randy Campbell, and Drew Medeiros. It was delivered to Hawaii in the spring of 2001, seeing first light in the summer of 2001.
NIRC2 is positioned behind the AO bench on the Left Nasmyth Platform of Keck II. The instrument operates from 1 to 5 µm, providing three selectable cameras to cover image sizes between 10"x10" and 40"x40". Two filter wheels with 18 positions each provide a variety of filters and/or grisms, while a focal plane mechanism provides slits and occulting spots for coronography. A dedicated slide carries larger grisms for spectroscopy. Six selectable pupil masks are available to reduce background noise sources; four of these rotate in concert with the telescope pupil and one is specific to spectroscopy. The detector is a 1024x1024 Aladdin-3 InSb array with four-quadrant readout into 32 channels.
2. Optical path
The light provided by the AO system enters the NIRC2 dewar through a CaF2 window. It then passes through two preslit blades which provide the first level of baffling. These movable blades change position depending on which camera is in use and whether or not a slit is in the beam. After the preslits the light is collimated. The beam comes to a focus where there are two slide mechanisms. The slit slide carries several slits of varying widths. A mask slide beneath it selects which slit provides light to the rest of the instrument. The slit slide also contains a set of coronographic spots. A third use of the slit and mask slides is to provide a focal plane baffle for imaging through the three cameras.
Beneath the slit is a wheel which provides a selection of pupil masks, including one for spectroscopy, and two rotating masks designed to block light from the spiders as well as the secondary obstruction. Next comes two filter wheels with 18 positions each. Below the filter wheels is a relatively slow shutter, which can be used to close off external light and may also be used to stop an exposure if, for example, the AO system loses lock on a target. The beam next passes through a grism slide, with three slots plus an open position.
Last in the optical path is one of three selectable cameras. These have nominal scales of 0.01, 0.02, and 0.04 arcsec/pixel, matching the expected diffraction performance of the telescope and AO system at different wavelengths (J, K, and M bands, roughly). The cameras focus onto the InSb detector, described in more detail below.
3. Mechanical description
All moving parts in NIRC2 are inside the dewar. The filter wheels and pupil mask are on rotating wheels, while other mechanisms (preslits, slits, coronagraphic spots, grisms, the shutter, and the cameras) are on slide mechanisms.
Cooling is provided by a closed-cycle system similar to that installed on NIRSPEC. Two cold heads provide three stages of cooling, controllable via software. Temperature sensors are provided on the detector head, optical bench, cold shield, and other places in the dewar.
4. Detector and Electronics
The detector is a 1024x1024 Aladdin-3 array with 27 µm pixels. The detector QE is ~ 80% at 1.7 microns.
The electronics provide three readout modes: single sample, CDS (correlated double sampling), and MCDS (multiple correlated double sampling) modes. The pixel sampling rate is nominally 250 kHz, but can be changed up to ~350kHz. Each quadrant is read out in eight channels (32 channels total). The gain of the detector is 4 electrons/DN.
The read noise in a CDS readout is 38 electrons. For MCDS mode with up to 64 reads, readout noise drops as the square root of the number of reads. Beyond that the noise continues to drop, although not as rapidly as the square root. It continues to drop to 512 reads, beyond which it has not been tested. Section 6.2 shows the read noise as a function of number of MCDS reads.
The detector is linear to about 10,000 DN. This is the result of a compromise
between linearity and dark current.
5. Observation modes
NIRC2 has three basic modes.
5.1 Imaging
Narrow- and broad-band filters are provided. The filter complement is given in the filter page, together with sensitivity and background values to aid in signal-to-noise estimates.
Three different cameras provide scales of 0.01, 0.02, and 0.04 arcsec/pixel. These provide good matches to the Keck diffraction size at J, K, and M bands.
The main concerns in imaging mode are image scale or field of view, filters, exposure times, and dither patterns. The "camera" command is used to select one of the three cameras in NIRC2.
Table 1: Camera Options
Camera Name(s) |
Scale (arcsec/pixel) |
Field of view (arcsec x arcsec) |
Band in which diffraction size matches 2 pixels |
wide cam04 0.04 |
0.04 |
40x40 |
M |
medium cam02 0.02 |
0.02 |
20x20 |
K |
narrow cam01 0.01 |
0.01 |
10x10 |
J |
Note that the camera command will take different names; it might be easier to remember the pixel scale rather than the relative field size, for example.
Also note that the medium-field camera has significant field curvature, hence image quality across the entire field suffers. It is possible to achieve high image quality for point sources, however.
For imaging, when a new camera is selected, the appropriate masks in the slit and slitmask slides are automatically put into place.
5.2 Coronagraphy
Occulting spots can be placed in the focal plane using the slit slide. The spots are opaque areas deposited on a quartz substrate. The spot transmissions are not zero, but have been measured to be 0.12% in both J and H, and 0.22% in K. (These numbers are relatively uncertain). A variety of spot sizes are available. The following lists their names, with the number after "corona" being the spot size in milliarcseconds:
| corona100 corona150 corona200 corona300 corona400 |
corona600 corona800 corona1000 corona1500 corona2000 |
5.3 Spectroscopy
Grisms may be installed either in the filter wheel or in a dedicated grism slide. Currently there are two grisms, both in the grism slide. The tables below list various useful parameters for NIRC-2 spectroscopy. The columns are:
- Camera
- Filter
- Order
- Central wavelength of the NIRC-2 filter (microns)
- Dispersion (Angstroms/pixel; remember that 1 Angstrom is 0.0001 microns)
- Wavelength range of the filter (microns)
- The number of pixels needed to cover the entire wavelength range. Bold red letters indicate that the entire filter passband will fit on the detector.
- The resolving power per pixel. If you use a three-pixel wide slit, e.g., your resolving power would be 1/3 that listed.
Table 2: LOWRES grism
|
Camera
|
Filter
|
Order
|
Central
wavelength (microns) |
Dispersion
(Ang./pix) |
Wavelength
range of filter (microns) |
# pixels
to cover range |
Resolving
power per pixel |
|---|---|---|---|---|---|---|---|
|
Narrow
|
J
|
6
|
1.248
|
1.092
|
0.163
|
1490
|
11,430
|
|
J
|
5
|
1.248
|
1.308
|
0.163
|
1250
|
9,540
|
|
|
H
|
4
|
1.633
|
1.628
|
0.300
|
1840
|
10,030
|
|
|
K
|
3
|
2.196
|
2.144
|
0.336
|
1570
|
10,240
|
|
|
Kp
|
3
|
2.124
|
2.144
|
0.336
|
1640
|
9,910
|
|
|
Medium
|
J
|
6
|
1.248
|
2.190
|
0.163
|
740
|
5,700
|
|
J
|
5
|
1.248
|
2.616
|
0.163
|
620
|
4,770
|
|
|
H
|
4
|
1.633
|
3.255
|
0.300
|
920
|
5,020
|
|
|
K
|
3
|
2.196
|
4.113
|
0.336
|
820
|
5,340
|
|
|
Kp
|
3
|
2.124
|
4.113
|
0.336
|
850
|
5,160
|
|
|
Wide
|
J
|
6
|
1.248
|
4.373
|
0.163
|
370
|
2,850
|
|
J
|
5
|
1.248
|
5.236
|
0.163
|
310
|
2,380
|
|
|
H
|
4
|
1.633
|
6.519
|
0.300
|
460
|
2,500
|
|
|
K
|
3
|
2.196
|
8.226
|
0.336
|
410
|
2,670
|
|
|
Kp
|
3
|
2.124
|
8.226
|
0.336
|
430
|
2,580
|
Table 3: MEDRES grism
|
Camera
|
Filter
|
Order
|
Central
wavelength (microns) |
Dispersion
(Ang./pix) |
Wavelength
range of filter (microns) |
# pixels
to cover range |
Resolving
power per pixel |
|---|---|---|---|---|---|---|---|
|
Narrow
|
J
|
6
|
1.248
|
0.644
|
0.163
|
2530
|
19,380
|
|
J
|
5
|
1.248
|
0.704
|
0.163
|
2320
|
17,730
|
|
|
H
|
4
|
1.633
|
0.929
|
0.300
|
3230
|
17,580
|
|
|
K
|
3
|
2.196
|
1.267
|
0.336
|
2650
|
17,330
|
|
|
Kp
|
3
|
2.124
|
1.267
|
0.336
|
2770
|
16,760
|
|
|
Medium
|
J
|
6
|
1.248
|
1.288
|
0.163
|
1270
|
9,690
|
|
J
|
5
|
1.248
|
1.407
|
0.163
|
1160
|
8,870
|
|
|
H
|
4
|
1.633
|
1.858
|
0.300
|
1610
|
8,790
|
|
|
K
|
3
|
2.196
|
2.534
|
0.336
|
1330
|
8,670
|
|
|
Kp
|
3
|
2.124
|
2.534
|
0.336
|
1390
|
8,380
|
|
|
Wide
|
J
|
6
|
1.248
|
2.576
|
0.163
|
630
|
4,840
|
|
J
|
5
|
1.248
|
2.797
|
0.163
|
580
|
4,460
|
|
|
H
|
4
|
1.633
|
3.420
|
0.300
|
880
|
4,770
|
|
|
K
|
3
|
2.196
|
5.078
|
0.336
|
660
|
4,320
|
|
|
Kp
|
3
|
2.124
|
5.078
|
0.336
|
690
|
4,180
|
Slits are also available in a variety of widths. A list is given below, where the number after "slit" gives the width in milliarcseconds.
| slit10 slit20 slit30 slit40 |
slit60 |
Note that since the slits and coronagraphic spots are on the same slide, it is not possible to do coronagraphic spectroscopy.
6. Observing with NIRC2
6.1 Sensitivities/backgrounds
Below is a table listing all filters available with NIRC2, including zeropoint and sky estimates (when measured), and the maximum exposure time expected in the narrow-field camera (before the sky saturates). See the NIRC2 webpage for the latest suite of filters.Table 4: Filters, sensitivities,
and background rates
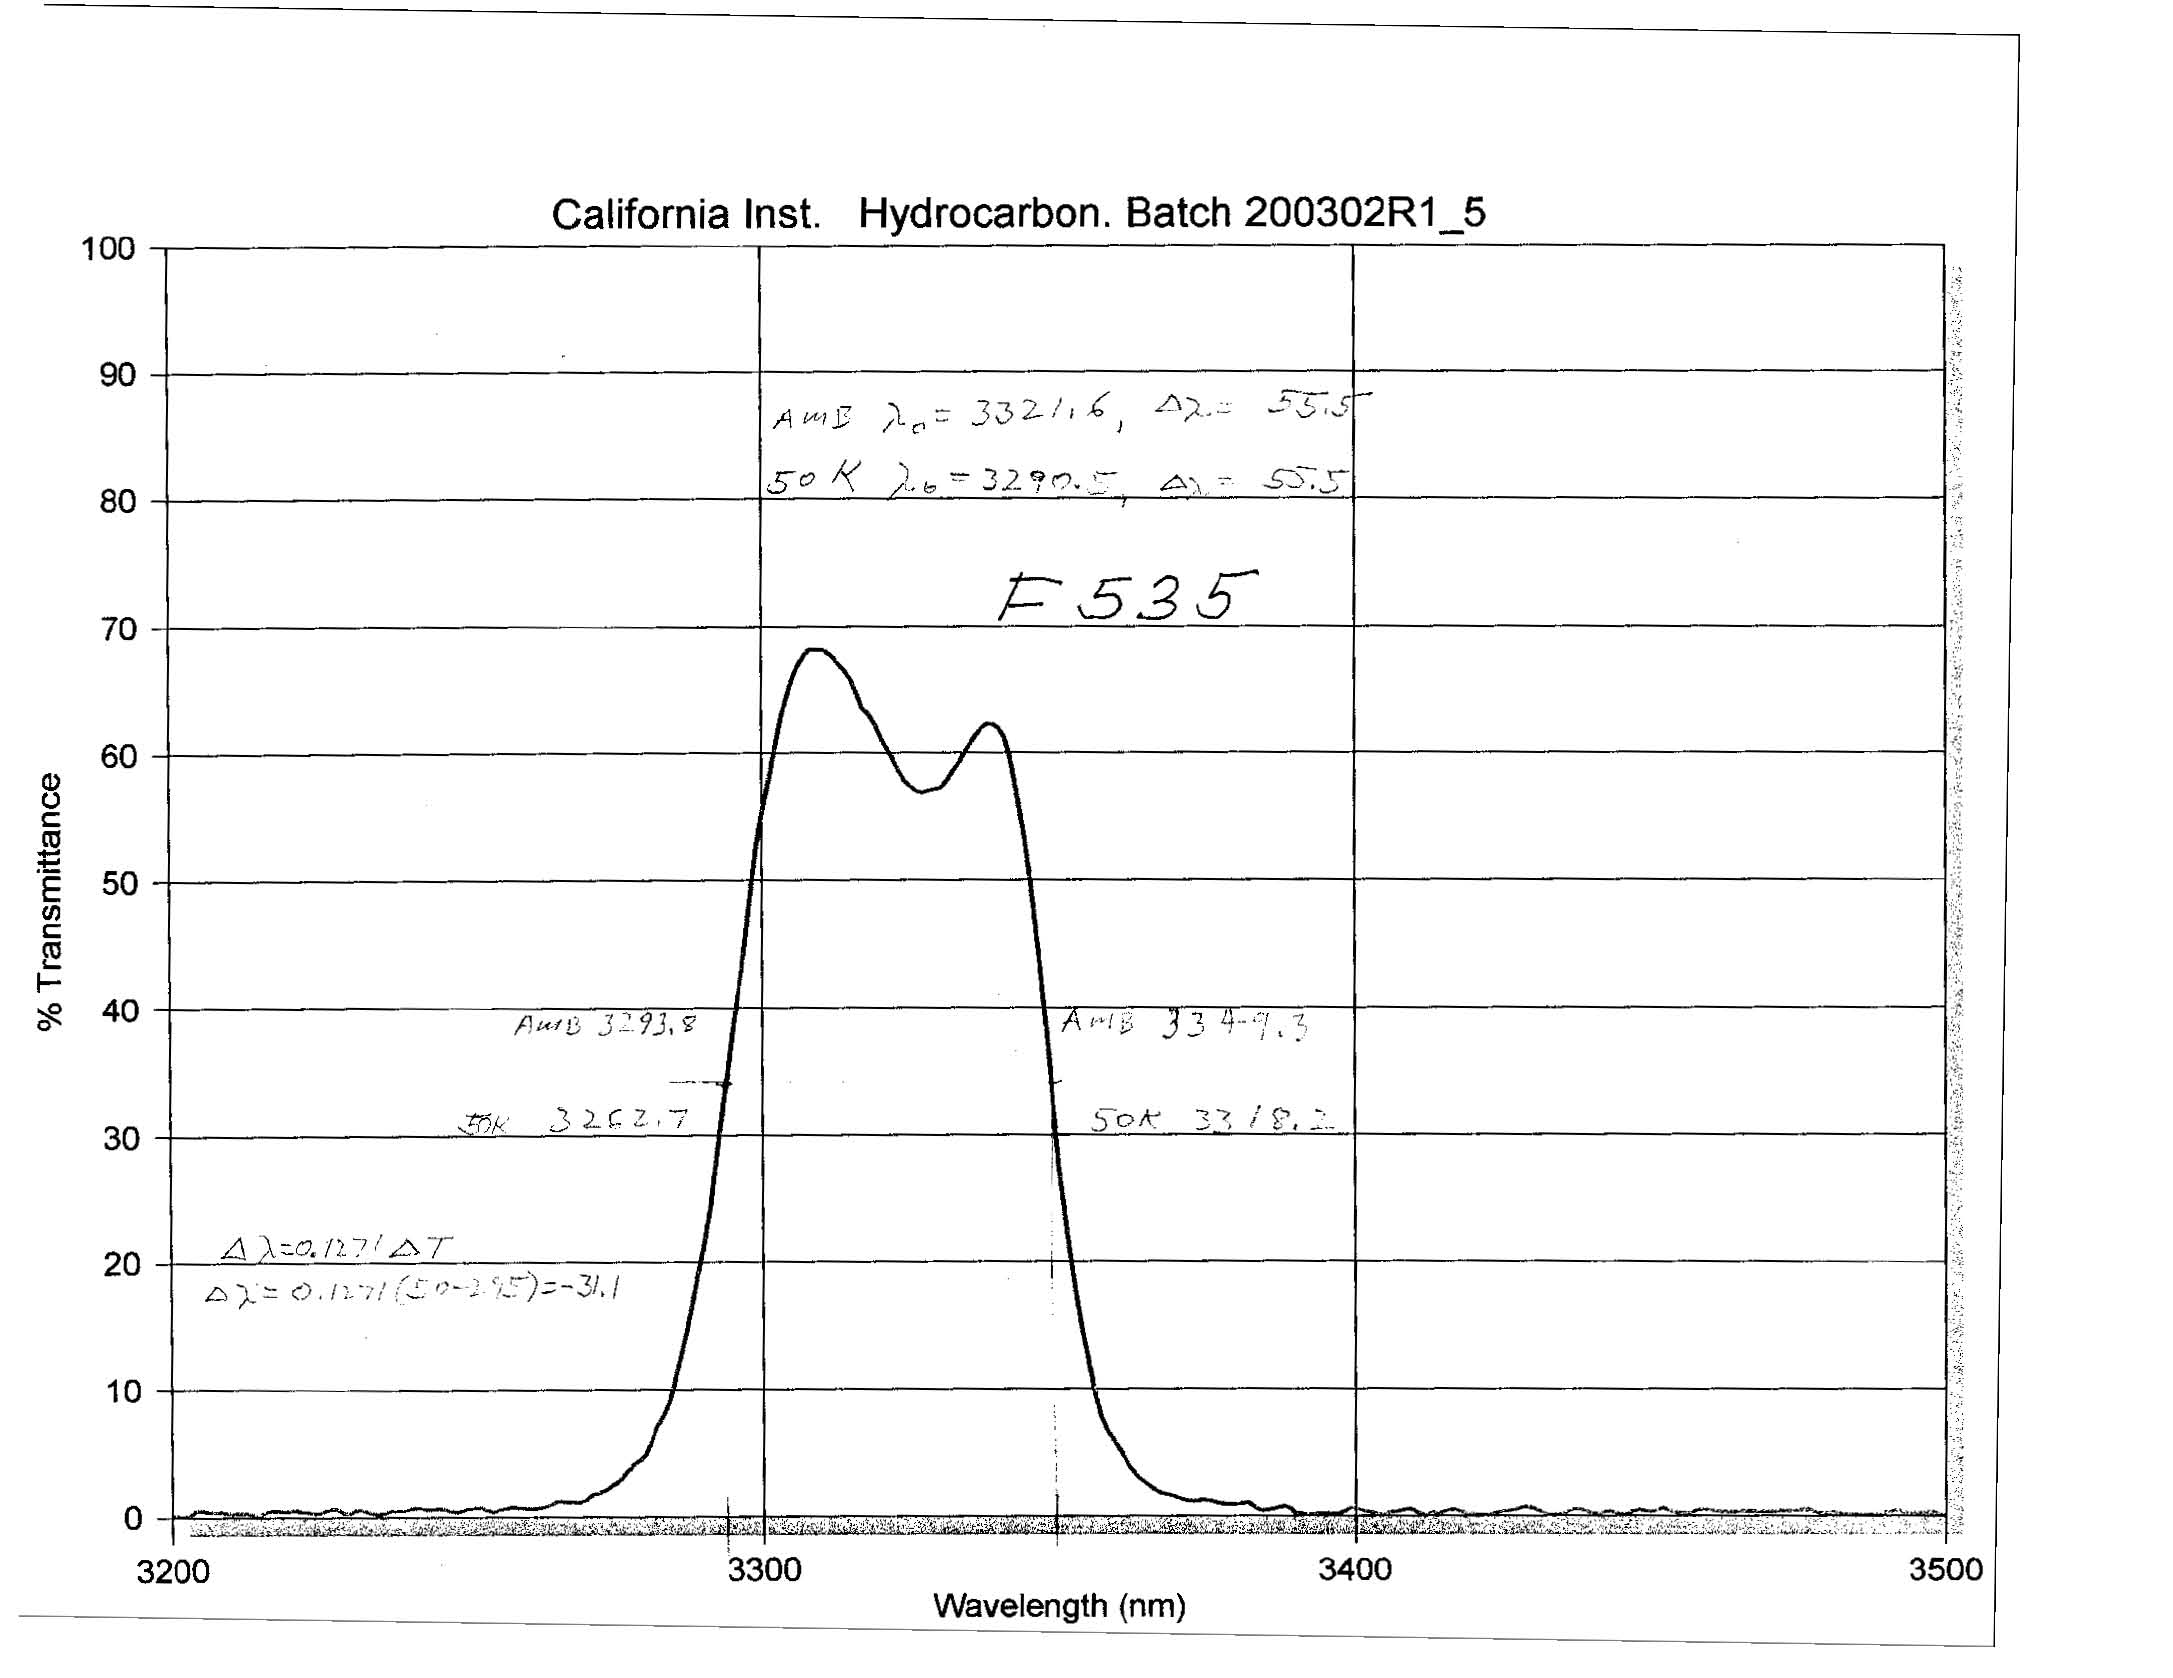
(Clicking on a filter name will bring up a plot of that filter's transmission
curve.)
Filter |
Central wavelength (µm) |
Bandpass |
Cut-On Wavelength (µm) |
Cut-Off Wavelength (µm) |
Photometric |
Sky (mag./ sq. arcsec) |
T(max) (sec) |
Broad Band |
|||||||
1.0311 |
0.0481 |
1.007 |
1.0551 |
||||
1.0180 |
0.0996 |
0.9682 |
1.0678 |
||||
1.248 |
0.163 |
1.166 |
1.330 |
||||
1.633 |
0.296 |
1.485 |
1.781 |
||||
2.196 |
0.336 |
2.028 |
2.364 |
||||
2.146 |
0.311 |
1.991 |
2.302 |
24.53 |
12.2 |
630 |
|
2.124 |
0.351 |
1.948 |
2.299 |
24.74 |
12.2 |
630 |
|
3.5197 |
1.3216 |
2.8589 |
4.1805 |
||||
3.776 |
0.700 |
3.426 |
4.126 |
||||
4.670 |
0.241 |
4.549 |
4.790 |
||||
Narrow Band |
|||||||
1.0847 |
0.0182 |
1.0756 |
1.0938 |
||||
1.096 |
0.016 |
1.088 |
1.104 |
||||
1.2132 |
0.0198 |
1.2033 |
1.2231 |
||||
1.2903 |
0.0193 |
1.2807 |
1.3000 |
||||
1.5804 |
0.0232 |
1.5688 |
1.5920 |
||||
1.5923 |
0.1257 |
1.5295 |
1.6552 |
||||
1.6455 |
0.0256 |
1.6327 |
1.6583 |
||||
1.6809 |
0.1368 |
1.6125 |
1.7493 |
||||
2.0563 |
0.0326 |
2.0400 |
2.0726 |
||||
2.1686 |
0.0326 |
2.1523 |
2.1849 |
||||
2.1281 |
0.0342 |
2.1112 |
2.1452 |
||||
| H2 v=2-1 | 2.2622 |
0.0388 |
2.2428 |
2.2816 |
|||
2.2706 |
0.0296 |
2.2558 |
2.2854 |
||||
2.2891 |
0.0267 |
2.2757 |
2.3024 |
||||
3.0629 |
0.1549 |
2.9855 |
3.1404 |
||||
3.2904 |
0.0555 |
3.2627 |
3.3182 |
||||
3.987 |
0.069 |
3.952 |
4.021 |
||||
4.052 |
0.068 |
4.018 |
4.086 |
||||
The NIRC2 Zero point values were updated after photometric tests in April 2004.
This table shows the zero-point, Z, and sky brightness, S, through various NIRC2 filters, combined with the narrow camera and the circumscribed pupil (the "open" position of the pupil wheel).
Z is the magnitude of the star + 2.5 log10 (counts/sec) - 2.5 log10(Strehl). Note that the Strehl ratio will vary according to atmospheic conditions (e.g. seeing), the brightness of the AO lock star, and the distance away from the lock star.
The gain, G, is 4.0 electrons/count.
S is the sky brightness in magnitudes per square arcsec. The sky background in counts per pixel is given by:
counts/sec/pixel = (arcsec/pixel)^2 * 10^[0.4*(Z-S)]
where (arcsec/pixel) is the pixel scale, e.g. 0.040 for the wide camera.
T(max) is the maximum exposure time without saturating the background in the narrow camera.
For different pupil masks:
Inscribed circle, subtract 0.4 from the zeropoints above, subtract 0.5 from
the sky backgrounds above.
The other pupil masks have not been measured, but they should lie between
these two extremes.
For different cameras:
T(max) should be divided by 4 for the medium camera, and 16 for the wide camera.
Notes:
a) The thermal bands have not been corrected for air mass. This is a future measurement.
b) The grisms have not been measured. A rough efficiency (not including slit losses) is 50% for the grism throughputs (slightly better at H and K).
6.2 Noise sources
Noise sources include noise in the electronics, statistical noise from the background, and statistical noise from the target itself. Which of these noise sources dominates depends on your observing mode. Bright targets will often be dominated by their own statistical noise, while faint targets may be dominated by background noise. In the thermal infrared (beyond ~ 2.5 µm) almost all observations are dominated by background.
Read noise depends on the readout mode of the detector. In CDS mode it is 38 electrons/pixel. In MCDS mode it drops roughly as the square root of the number of reads until around 64 reads, then drops more slowly until at least the 512-read level. A plot of the read noise vs. number of MCDS samples is shown below:

Figure 1. Read noise vs. number of MCDS samples.
Statistical noise from the target and background are simply the square root of the number of electrons recorded from the source.
Dark current is also a function of the number of MCDS samples. This is because every time the detector is read the four on-chip amplifiers glow slightly. This glow shows up as an elevated background and rises in the background in the four corners of the image. The figure below shows the dark current (in DN/sec) as a function of the number of MCDS reads for a 200 sec. exposure. The drop in effective dark currrent above 300 samples is not understood.

Fig. 2. Dark current vs. number of
MCDS samples (200 sec exposure).


